There’s been a major data paradigm shift happening over the last few years that’s ultimately to your advantage. In the auto industry specifically, even though we’re coming off an unprecedented year and are in what feels like a crazy market right now, there’s a big opportunity to capitalize on recent advancements in data processing and insights available. For dealers, OEMs, and other players in automotive, it’s important you know about it so that you can plan for success today and in the future.
The Data Paradigm Shift
From 2005-2016 we saw the ‘big data’ revolution. During this period, everyone was collecting massive amounts of data and at the time, there weren’t even computers or processing powers capable of analyzing the amount of data that was being collected. We were just collecting more and more data without being totally sure what we were going to do with it.
Around 2016 we were left with a data hangover where we had access to all this data, but didn’t know where to start or how to parse through it to turn it into meaningful data with valuable insights. That brought about a new shift in the data revolution where actionable data and data storytelling became much more powerful and interesting. Thanks to advancements in data warehousing, processing, and visualization, we can now pull data from disparate sources and access first-party intent data to mine insights in new, easily accessible ways that we previously wouldn’t have had access to.
What this means for the average business is that you don’t need a development team or a data scientist to leverage your data and benefit from the data paradigm shift. Whether you manage a car dealership, operate an auto group, or represent an OEM, you can use fewer reports and less data, but get better, more actionable insights. When you harness your own data, you can improve the customer experience and improve sales results.
The Foureyes Dataset
We are providing a bit of foreshadowing on some exciting things we are working on behind the scenes, but while we toil away, we are releasing more and more free data as part of our commitment to empowering dealers to harness their own data.
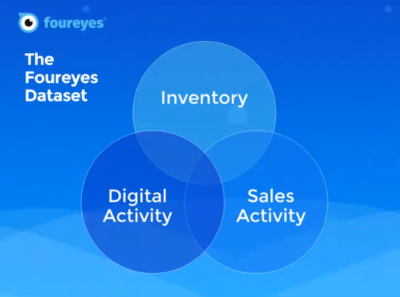
The Foureyes’ unique dataset combines inventory data with customer activity and sales activity data from more than 19,000 car dealership websites. Pulling these three disparate data sources together allows us to paint a complete picture of what’s happening online for dealerships across the country; from the pricing and inventory their prospects are browsing to the lead handling and sales process benchmarks that can make or break sales each month.
It’s a massive amount of data that’s collected and cleaned nightly and then used to power the Foureyes modules. From Omni-Tracking and Safety Net to Prospect Engagement and Sales Enablement, each module is essentially a different, curated view of the data. The fact that each view is narrowed down is part of what makes these modules successful. We filter the available data down to what’s really important and actionable so that you aren’t hunting through data points to understand what the data is really telling you.
Free Data From Foureyes
In addition to powering the Foureyes product, we believe in the power of this data so much that we give a lot of it away for free. We offer a 60-day free trial so that dealers can experience the impact at their own business before purchasing, and we also maintain a data hub with three interactive dashboards for the auto industry.
From inventory to customer insights, the data in these dashboards can help you track trends and determine long-term strategies.
U.S. NEW CAR SALES DATA
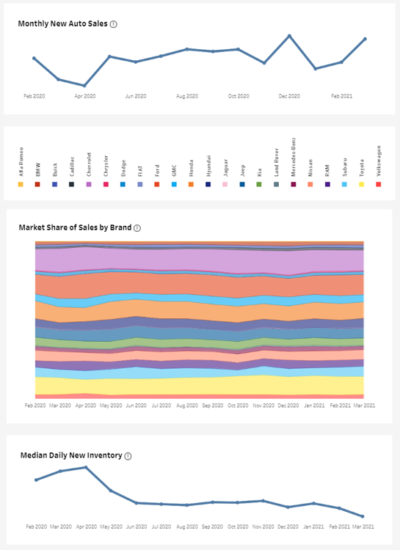
The new car sales dashboard allows everyone from OEMs to car shoppers to monitor trends and understand the market a little better. The dataset shows monthly and year-over-year auto sales data for new inventory and includes sales and inventory level trends by brand and/or state over time.
You can custom-fit the data in the dashboard to answer specific questions about the market by selecting just the brands you’re interested in. If you’re curious about Chevrolet, Ford, and RAM truck inventory, you can apply the appropriate filters to review market share and compare sales and inventory insights across the country or broken up by state. Adjust the time frame to zero in on the exact information you’re looking for. Learn more about how to interact with the new car sales data here.
MODEL YEAR & INVENTORY LEVEL DATA
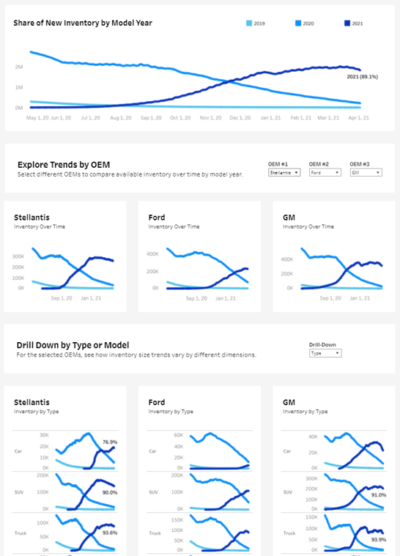
We originally released the inventory levels by model year dashboard to track the annual release of new model year inventory. This dashboard tracks new inventory by model year and brand, getting more specific as you scroll through the graphs.
You can select up to three brands to focus on and choose to segment by inventory type or specific model to answer the specific questions you may have about what inventory is available and selling through over time. If you’re interested in comparing by vehicle segment, you can compare cars, trucks, SUVs, and vans. Or, filter by specific models to compare your best selling inventory against your competitors. Learn more about the model year inventory data here.
VEHICLE PRICING DATA
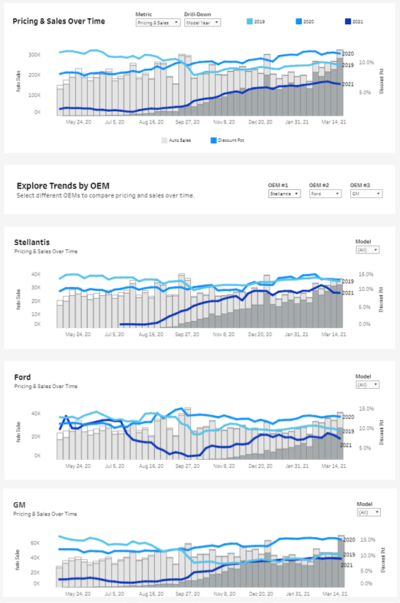
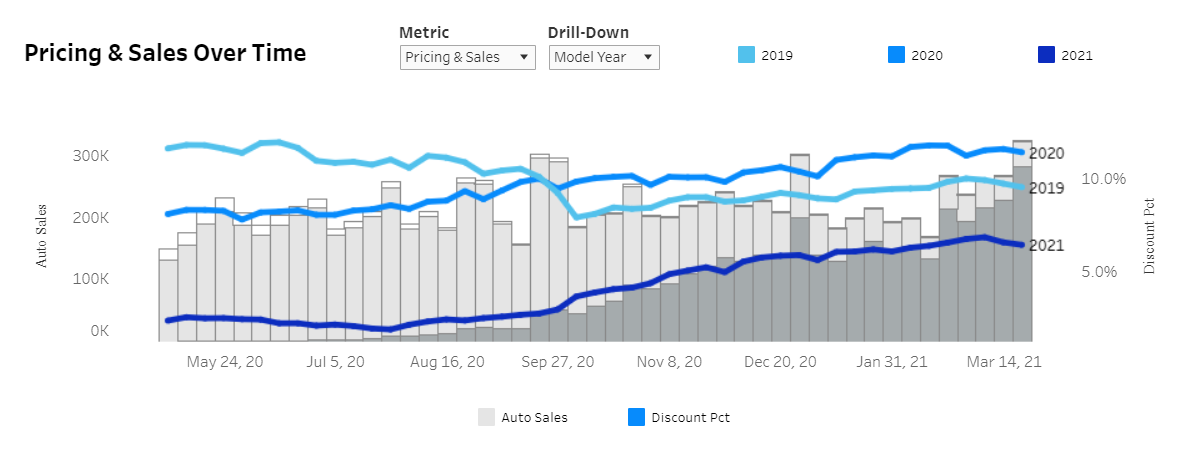
A combination of sales and pricing data, we released this dashboard as a complement to the previous two dashboards to enable users to see car sales against pricing data over time. This dashboard is helpful to track discounting, especially by brand and model, and understand how discounts and promotions may be impacting sales across the country.
You can select up to three brands to focus on and choose to segment by pricing, sales, and model year to answer any questions you may have. Segment the data by brand and model to narrow in on specific pricing insights over time. Hover over each graph to see average discount percentages and percent of sales by model year. Not only does this allow you to track sales by brand, it sheds light on the impact that advertised discounts or promotions may have on model sales. Learn more about the pricing data and insights here.
Custom Data from Foureyes
We maintain these dashboards to provide a free way for dealers and OEMs to gain a better understanding of the market in real time. Spend some time with the data in each dashboard and remember to check back after sales close each month for new insights.
If there is specific data you’d like to see that’s not currently available or you’re not able to answer a question through your own data mining, don’t hesitate to reach out. Email [email protected] and I can help provide a deeper dive or discuss a custom dataset with our data science team.
