Current inventory shortages have brought a new season of disruption to automotive.
To monitor changing inventory levels over time, Foureyes released a new data visualization sharing some of the publicly-available data we use to power our products. Updated weekly, use the interactive dashboard to track new and used inventory shortages by brand and drill down to the specific vehicle types and models that are declining the fastest.
New & Used Inventory Over Time
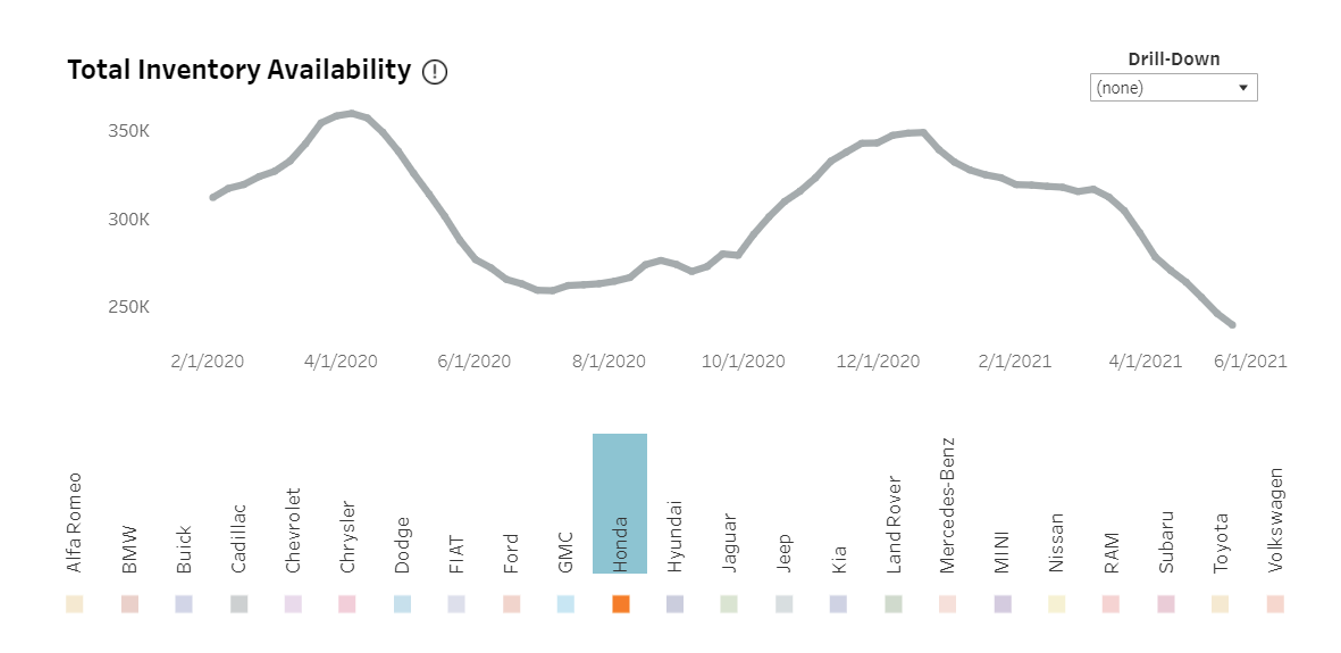
Review total inventory levels since February 2020. Drill down by body type or condition to overlay different market segments. To get a better understanding of exact changes, hover over the graph for week-over-week, month-over-month, and year-over-year insights.

To filter data by a specific automotive brand, choose from the list of brands included below the graph. You can do this by clicking one or holding down CTRL and selecting multiple brands. This choice will also be reflected through the rest of the dashboard.

New Inventory Levels by Automotive Brand
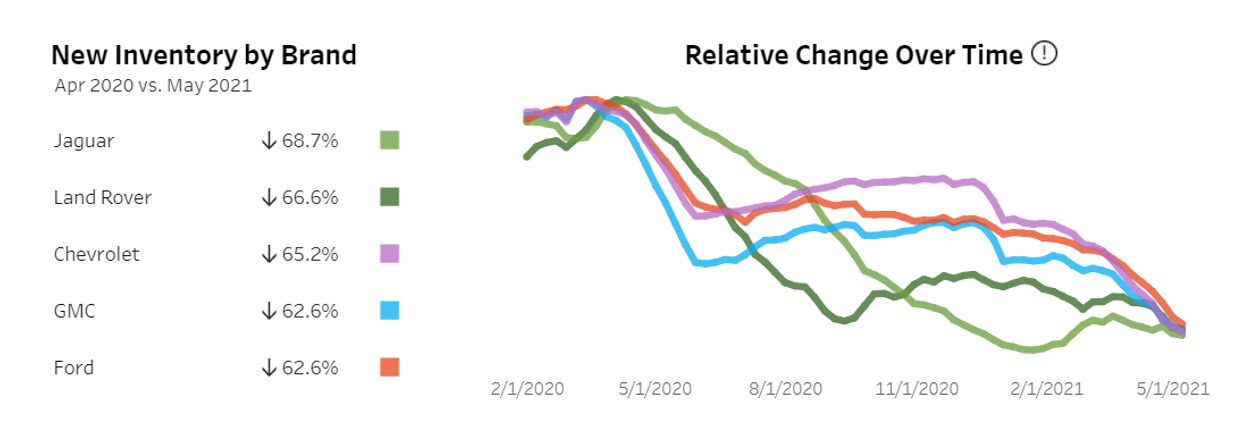
Review new inventory levels by brand. Select up to 5 automotive brands to compare and filter by vehicle type if desired. Hover over the graph to better understand weekly, monthly, and year-over-year changes. Please note that all brand comparisons are relative, so you can see the decline across brands. The selected brands do not necessarily have equal inventory sizes—the charts have been normalized in order to report on them at the same scale.

Used Inventory Levels by Automotive Brand
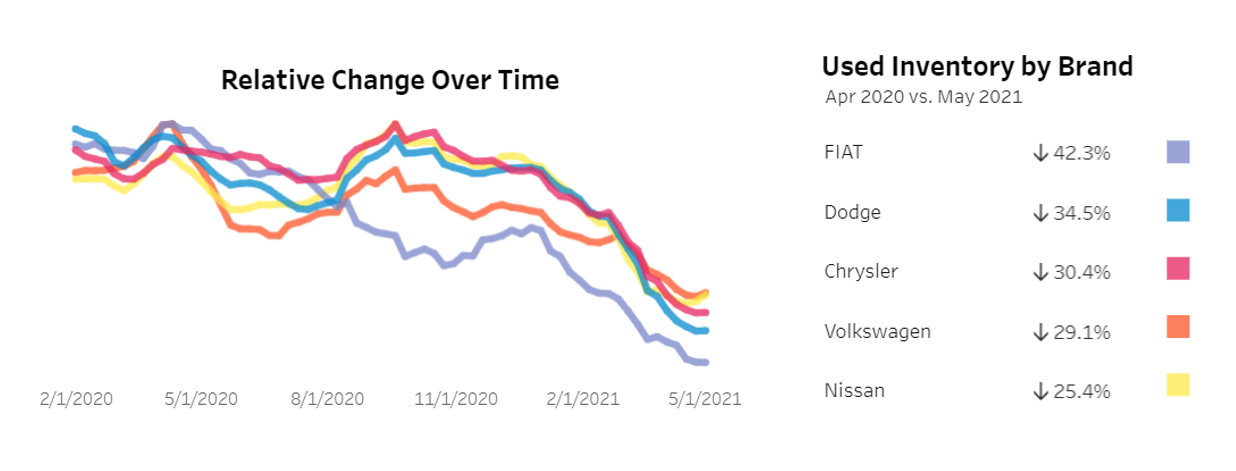
Compare used inventory levels by brand. Select up to 5 automotive brands and filter by vehicle type if desired. Hover over the graph to better understand weekly, monthly, and year-over-year changes.

Models with the Greatest Decline in Availability
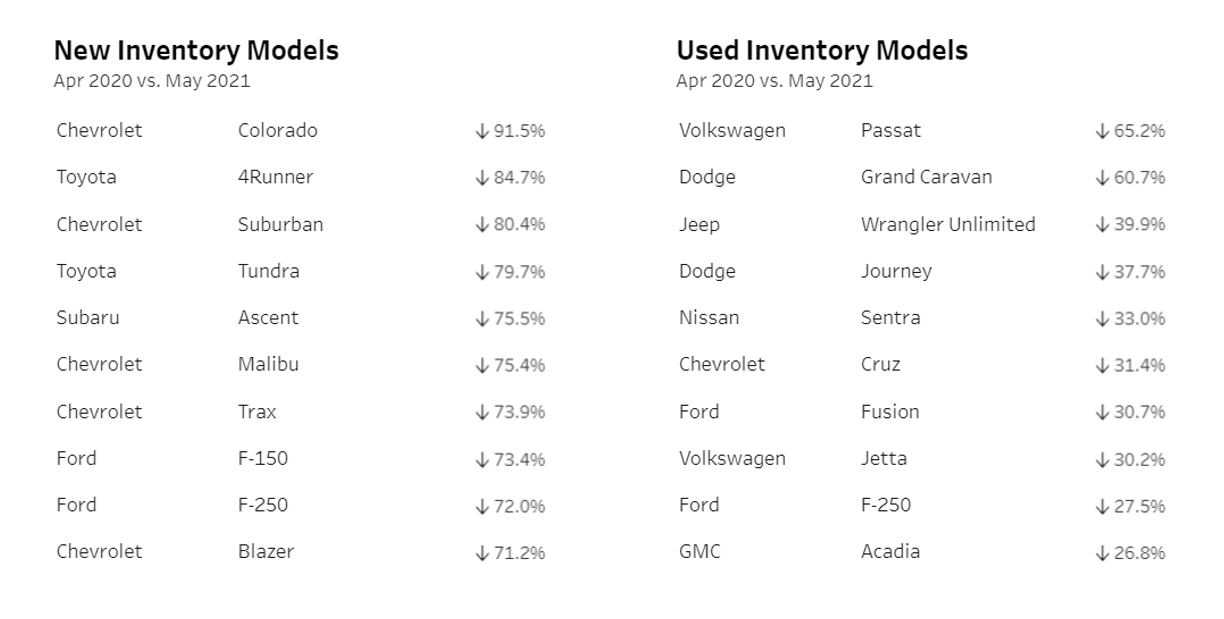
See which models have seen the steepest decline in inventory size since April 2020. These tables each display up to 10 models, sorted by greatest percent decrease. Only models with a peak inventory that exceeds the respective new and used thresholds will be displayed in these lists; adjust the thresholds down to 0 to look across all models.

Learn More
If you’re interested in additional inventory data and interactive resources, visit our data hub. For custom requests or insights, email our team and we can help provide a deeper data dive. For press inquiries or requests, please contact [email protected].
