Start the new year off strong by reviewing your sales performance and creating 2020 goals. See how your dealership stacks up against the competition and use these auto industry benchmarks to develop a marketing and sales strategy for the new year.
We analyzed Foureyes data from more than 370 million website visits and thousands of automotive dealerships across the country over the last year (November 2018 - 2019) to report on trends and key performance indicators for the automotive industry. These sales and marketing benchmarks can be used to guide your strategy and set the course for 2020. Review the insights and download the complete infographic below.
Inventory Management
Do you know how your new and used inventory compares to dealers of your size? How about within your state and against neighboring states? To stand out from the crowd in the auto market, it’s important to know how your pricing and inventory stacks up against the competition.
Segmented by size, here is your inside look at how pricing and online inventory is handled by small, medium, large, and luxury car dealerships:
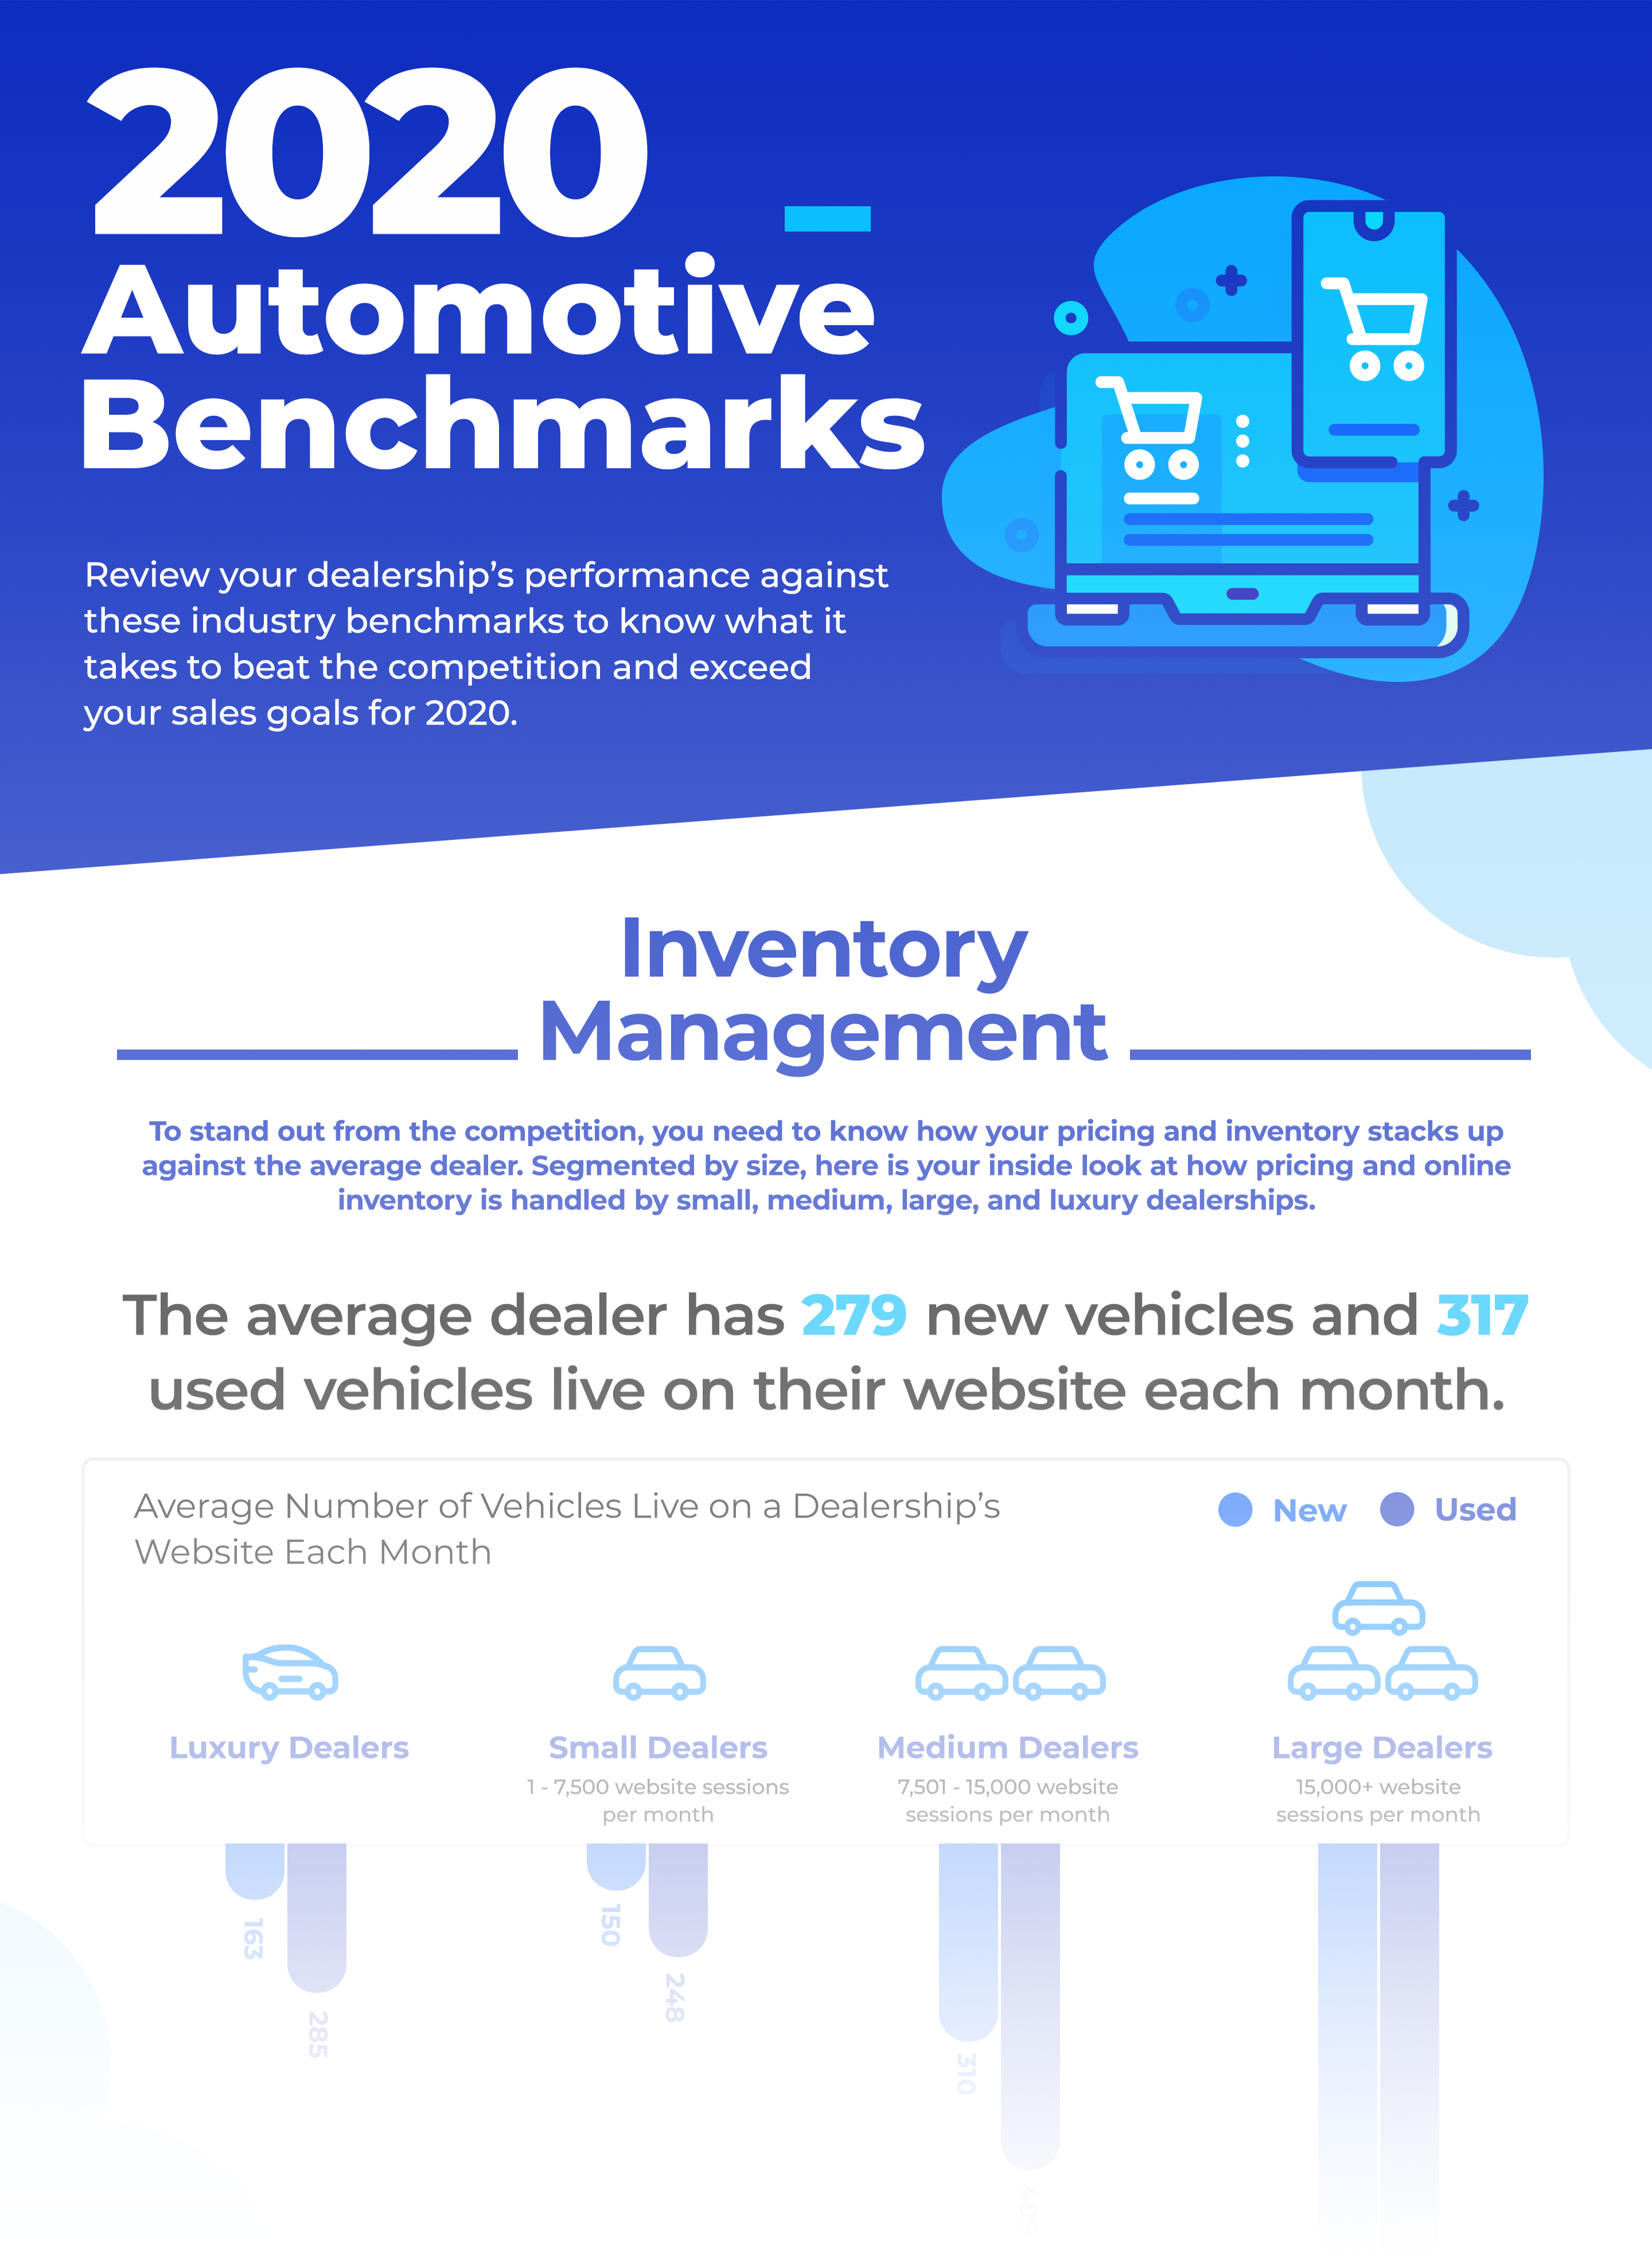
- The average car dealer has 279 new vehicles and 317 used vehicles live on their website each month
- The average car dealer adds (+68) new vehicles and (+89) used vehicles to their website each month
- The average car dealer removes (-54) new vehicles and (-108) used vehicles from their website each month
- Only 18% of car dealerships list price or conditional price for their entire inventory.
Average Number of Vehicles Listed on a Dealership’s Website Each Month
| TYPE OF AUTO DEALERSHIP | AVERAGE NEW INVENTORY PER MONTH | AVERAGE USED INVENTORY PER MONTH |
|---|---|---|
| Luxury dealers | 163 | 285 |
| Small dealers, with less than 7,500 website sessions/month | 150 | 248 |
| Medium dealers, with 7,501-15,000 website sessions/month | 310 | 409 |
| Large dealers, with more than 15,001 website sessions/month | 575 | 627 |
| OVERALL | 279 | 317 |
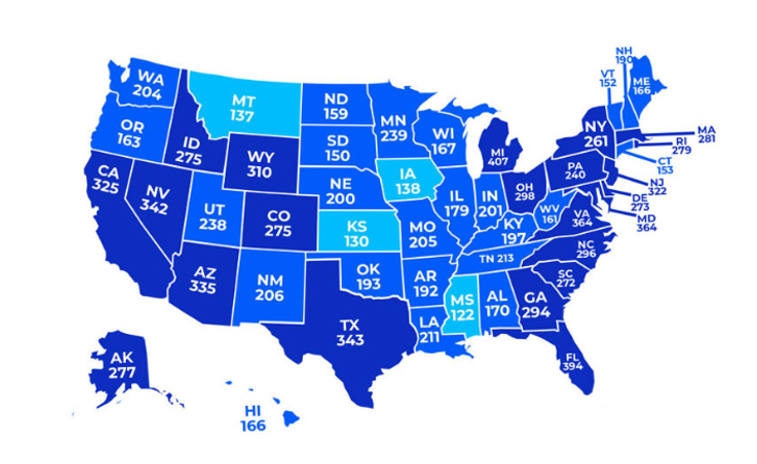
Average Number of New Vehicles Listed on a Dealership’s Website Each Month by State

Average New Inventory Added and Removed Each Month
| TYPE OF AUTO DEALERSHIP | AVERAGE NEW VEHICLES ADDED TO ONLINE INVENTORY | AVERAGE NEW VEHICLES REMOVED FROM ONLINE INVENTORY |
|---|---|---|
| Luxury dealers | 33 | 33 |
| Small dealers, with less than 7,500 website sessions/month | 33 | 32 |
| Medium dealers, with 7,501-15,000 website sessions/month | 72 | 68 |
| Large dealers, with more than 15,001 website sessions/month | 148 | 137 |
| OVERALL | 68 | 54 |
Average Used Inventory Added and Removed Each Month
| TYPE OF AUTO DEALERSHIP | AVERAGE USED VEHICLES ADDED TO ONLINE INVENTORY | AVERAGE USED VEHICLES REMOVED FROM ONLINE INVENTORY |
|---|---|---|
| Luxury dealers | 49 | 77 |
| Small dealers, with less than 7,500 website sessions/month | 97 | 97 |
| Medium dealers, with 7,501-15,000 website sessions/month | 173 | 171 |
| Large dealers, with more than 15,001 website sessions/month | 278 | 276 |
| OVERALL | 89 | 108 |
Average Number of Price Adjustments Each Month
| TYPE OF AUTO DEALERSHIP | AVERAGE NEW PRICE ADJUSTMENTS PER MONTH | AVERAGE USED PRICE ADJUSTMENTS PER MONTH |
|---|---|---|
| Luxury dealers | 671 | 795 |
| Small dealers, with less than 7,500 website sessions/month | 549 | 413 |
| Medium dealers, with 7,501-15,000 website sessions/month | 899 | 710 |
| Large dealers, with more than 15,001 website sessions/month | 1,429 | 1,029 |
| OVERALL | 862 | 734 |
Lead Attribution
Most dealers track the source of their leads, but aren’t getting accurate attribution data because their pipeline is diluted by bots, solicitors, job seekers, service customers, and other non-sales leads. When you know where your leads are really coming from, you can clearly see which channels are (or aren't) sending you quality leads and make smarter sales and marketing decisions.
To report on true sales opportunities and accurate attribution data, the insights below distinguish between:
- Leads in your CRM who have called, filled out a form, chatted, or performed some other lead action
- Qualified sales leads that are confirmed to be in the market to purchase a vehicle, with service and other non-sales leads filtered out
- Sold leads that have completed the sales process and purchased a vehicle
Looking at data from millions of website visits and thousands of automotive dealerships across the country:
- The average user views 1.2 VDP pages
- The average qualified sales lead views 6.9 VDP pages
- The average sold lead viewed 7.5 VDP pages before the sale
- Looking at lead source by channel, Direct traffic is the largest bucket for sales, closely followed by Organic
- Looking at forms, chats, and phone calls, website forms are the most common lead source for sales
Average Source by Channel
| LEAD SOURCE BY CHANNEL | LEADS | QUALIFIED SALES LEADS | SALES |
|---|---|---|---|
| Organic | 38.7% | 37.2% | 34.0% |
| Direct | 27.5% | 30.8% | 35.7% |
| Paid | 23.3% | 21.2% | 21.4% |
| Referral | 8.8% | 8.9% | 7.9% |
| Social | 1.7% | 1.9% | 1.0% |
Average Source by Lead Action
| LEAD SOURCE BY CHANNEL | LEADS | QUALIFIED SALES LEADS | SALES |
|---|---|---|---|
| Phone Call | 62.6% | 22.5% | 24.6% |
| Form | 32.4% | 69.1% | 68.9% |
| Chat | 5.0% | 8.4% | 6.5% |
Sales Process
As a business owner, it’s crucial to track the efficiency and effectiveness of your sales process to get the most from your pipeline. Sales process often impacts lead engagement and conversion more than you realize. By monitoring lead handling indicators like CRM utilization, missed calls, follow-up response time, and close rate, you can improve the overall buying experience and sell more cars.
Looking at the average dealer as well as dealerships segmented by size, here is a peek into U.S. auto sales and close rates across the country:
- The average car dealership has 166 qualified sales leads each month
- 13.3% of sales prospects do not make it into the CRM
- The average car dealership close rate is 12.5%
- The average call wait time is 95 seconds
- 8.5% of calls from sales prospects are missed
- 23.5% of the average dealer’s leads are flagged for not receiving follow-up within 24 hours
- 67.3% of these flagged sales leads do not receive follow-up within 1 week or longer
Average Qualified Sales Leads Per Month
| TYPE OF AUTO DEALERSHIP | QUALIFIED SALES LEADS PER MONTH |
|---|---|
| Luxury dealers | 125 |
| Small dealers, with less than 7,500 website sessions/month | 48 |
| Medium dealers, with 7,501-15,000 website sessions/month | 95 |
| Large dealers, with 15,001 | 228 |
| OVERALL | 166 |
Average Car Dealership Close Rate
| TYPE OF AUTO DEALERSHIP | AVERAGE CLOSE RATE |
|---|---|
| Luxury dealers | 13.4% |
| Small dealers, with less than 7,500 website sessions/month | 11.6% |
| Medium dealers, with 7,501-15,000 website sessions/month | 12.3% |
| Large dealers, with 15,001 | 12.6% |
| OVERALL | 12.5% |
Average Flagged Leads Per Month
| TYPE OF AUTO DEALERSHIP | AVERAGE FLAGGED LEADS* |
|---|---|
| Luxury dealers | 22.9% |
| Small dealers, with less than 7,500 website sessions/month | 22.0% |
| Medium dealers, with 7,501-15,000 website sessions/month | 20.9% |
| Large dealers, with 15,001 | 24.1% |
| OVERALL | 23.5% |
*No recorded follow-up within 24 hours

Curious how last year compares? Review the 2019 Benchmarks Report.
If you’re looking for a simple way to track and analyze these metrics, get in touch. Foureyes has data-driven products that provide actionable data and insights to power your sales. Request a free demo to learn about the sales essentials that make sales teams more efficient and effective to help close rates.
