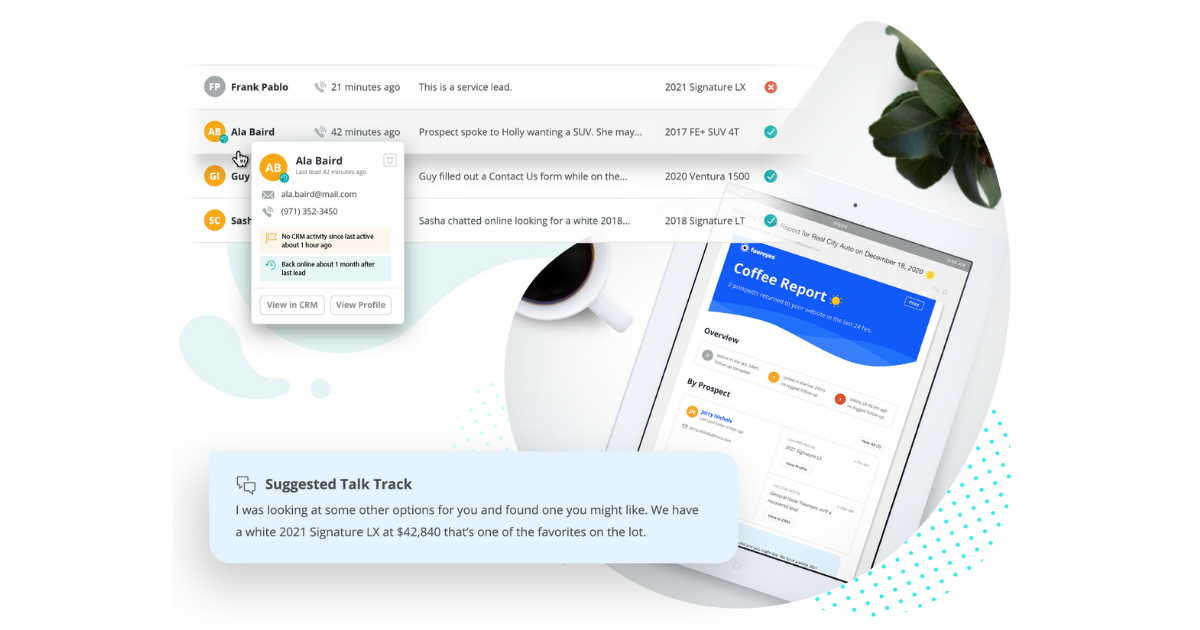
Big budgets are spent on lead generation efforts in automotive—and cracks in your sales pipeline means waste. Better understanding of lead handling and sales benchmarks for the average dealership can help you identify opportunities to save and convert more leads at your own.
To help car dealers understand lead handling data from the last year, we’re sharing prospect and sales insights pulled from Foureyes’ unique dataset of more than 19,000 automotive dealership websites from December 2019-November 2020. You can learn more about Foureyes data and explore additional insights here.
Here is your glimpse into lead management and close rate at dealerships across the country.
Lead Handling Benchmarks
LEAD CAPTURE
If you look at the total number of leads, meaning the number of people who have called, filled out a form, or chatted online with a car dealership, the average dealer generates 278 leads per month.
But when you filter out qualified sales leads from the total lead pool and just look at the total number of leads who are confirmed to be in the market to purchase a vehicle, with service and other non-sales leads are filtered out, the average car dealership actually generates 114 qualified sales leads each month.
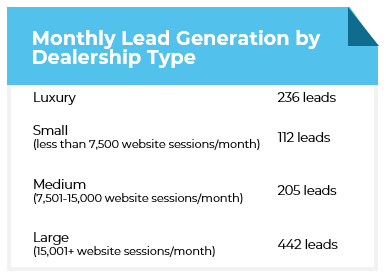
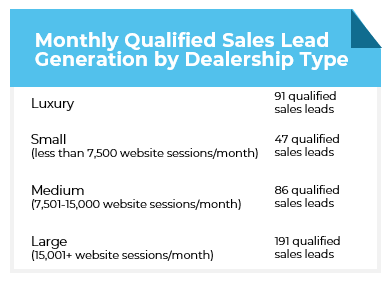
If you’re not separating your high- and low-quality leads, and you’re anything like the average dealership, less than half of your prospects each month are actually sales-qualified. A lot of time may be wasted on non-sales opportunities. Make sure your sales team is set up for success and your pipeline is automatically filtering out any non-relevant prospects.
LOST LEADS
Even worse than spending time on non-sales leads? Losing qualified sales leads who are actively shopping online due to issues with your sales process.
Looking at data from 2019-2020:
- 10.6% of website leads are never logged in the CRM (including calls, forms, and chats)
- 8.7% of calls from qualified sales leads are missed
- And for the calls that are answered, the median hold time for leads is 71 seconds
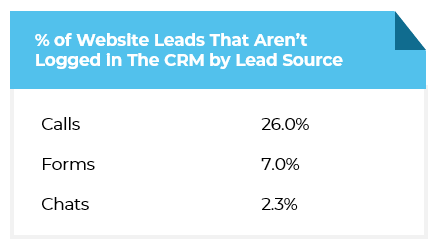
Don’t let your hottest leads sit on hold or fall out of your sales process entirely. Use a CRM safety net to capture the calls, forms, chats, and leads who would otherwise slip out of your sales process.
Sales Process Benchmarks
RETURNING LEADS
On an average day, 57.6% of the qualified sales leads who are shopping your website are return visitors. The average qualified sales lead views 8.7 VDPs and may return to your site multiple times to browse inventory.
Because of this, many of your web leads are actually return visitors:
- Among call leads, 48.2% are return visitors and 51.8% are new
- Among form leads, 59.7% are return visitors and 40.3% are new
- Among chat leads, 52.7% are return visitors and 47.3% are new
FLAGGED LEADS
These qualified sales leads may continue shopping online long after you’ve marked them ‘lost.’ Foureyes tracks when a returning lead is active on a car dealership’s website but no follow-up activity is recorded in the CRM within 24 hours of the visit. When this happens, the lead is flagged. For the average dealership, 38.9% of qualified sales leads are flagged.
That means for the average dealership, almost half of their sales-qualified leads are actively browsing online and showing buying interest, but not receiving timely follow-up.
- 34.5% of call leads are flagged
- 39.3% of form leads are flagged
- 32.9% of chat leads are flagged
And the problem isn’t just that engaged leads aren’t receiving follow-up within 24 hours. Of the 38.9% of leads that are flagged:
- 13.9% do not receive follow-up within 24 to 48 hours
- 21.1% do not receive follow-up within 48 hours to 1 week
- 65.0% do not receive follow-up after 1 week or longer
Sales intelligence software that tracks the website activity of leads and sends active lead alerts to sales teams to ensure no active prospects go without follow up from a member of your sales team.
MISHANDLED LEADS
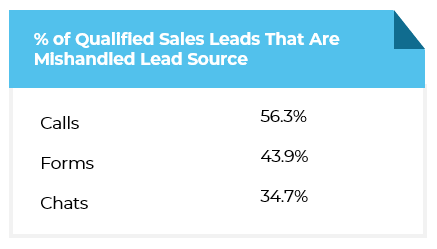
Altogether, qualified sales leads that are missed, flagged, or not logged in the CRM are considered mishandled. 46.7% of the average dealership’s qualified sales leads are mishandled.
CLOSE RATE
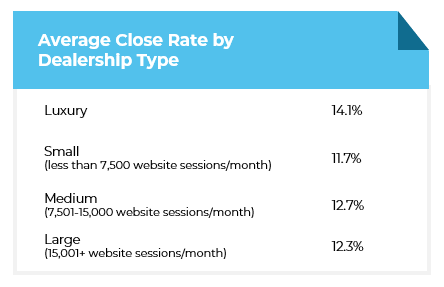
So what do close rates look like for the average dealership? From December 2019-November 2020, the close rate of qualified sales leads at the average dealership was 12.4%.
Does that seem high or low to you? The good news is, with insight into lead handling and sales process at your dealership, you can help your sales team work smarter and turn more shoppers into buyers. Learn how Foureyes can help. Watch this 10-minute demo or sign up for a personalized walkthrough to see how you can beat these benchmarks and sell more efficiently and effectively.
