At Foureyes, we love data. But we especially love competitive data that can help businesses better understand the market and improve sales outcomes. To help car dealers understand what inventory management looked like over the last year, we wanted to focus on inventory and pricing benchmarks for automotive.
For the insights shared below, we analyzed Foureyes data from December 2019-November 2020, covering more than 25 million unique pieces of inventory across 19,000 automotive dealership websites. The median was used to report on trends, and the dataset was refreshed in January 2021 to accommodate additional automotive brands.
Automotive Inventory Insights
INVENTORY AVAILABILITY
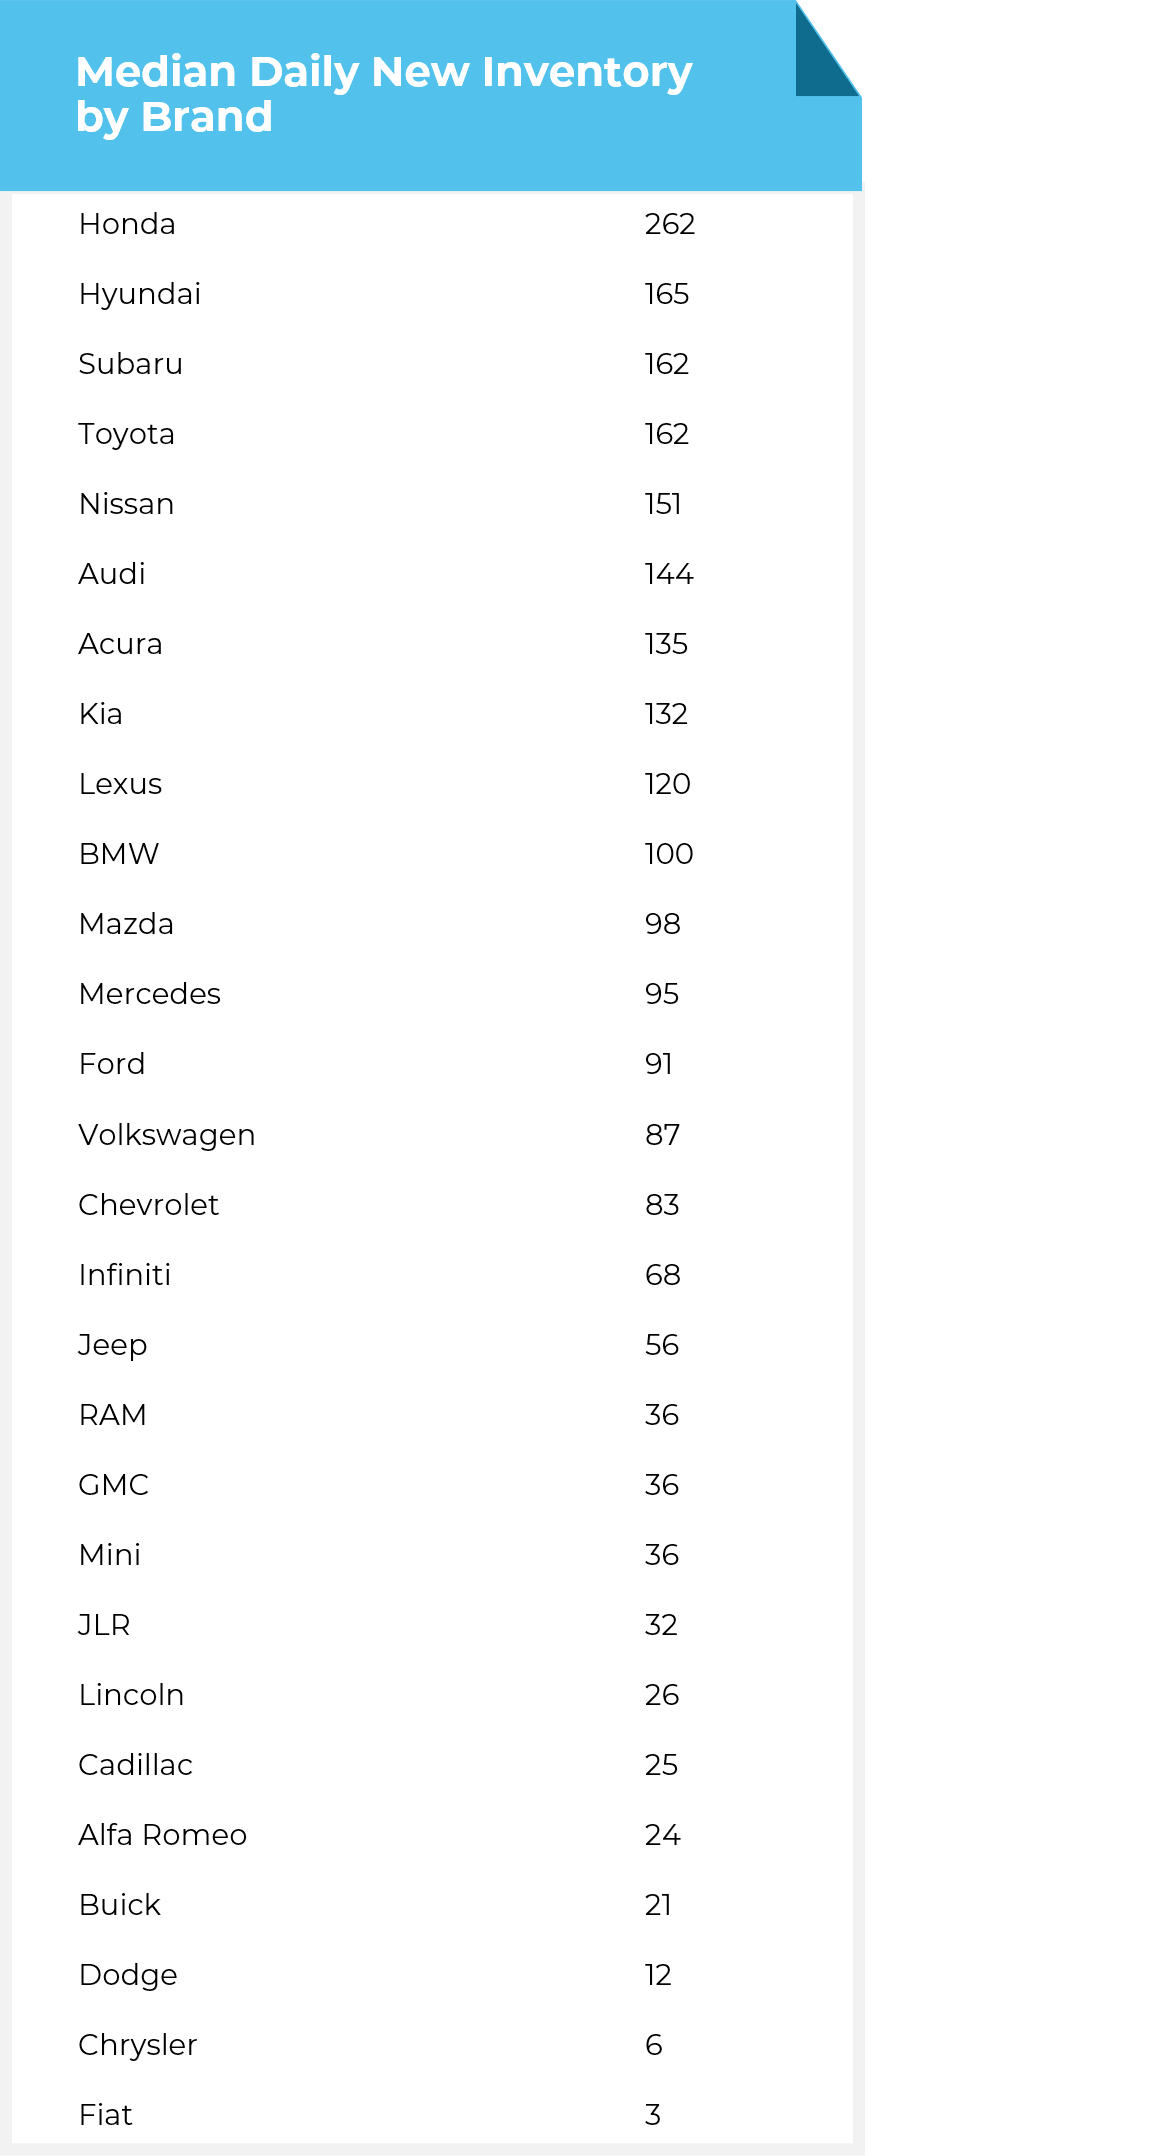
As of November 2020, the average car dealer had 108 new vehicles and 103 used vehicles in its online inventory. When we break the data down by brand, Honda stands out above the rest with a median daily inventory of 262 new vehicles per dealer.
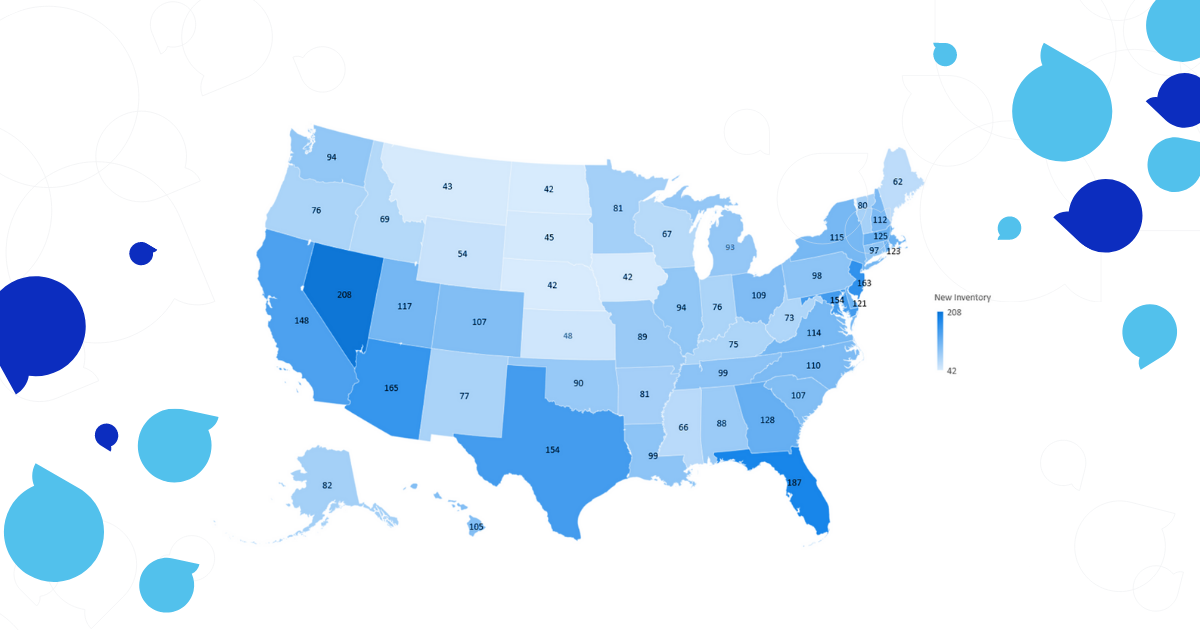
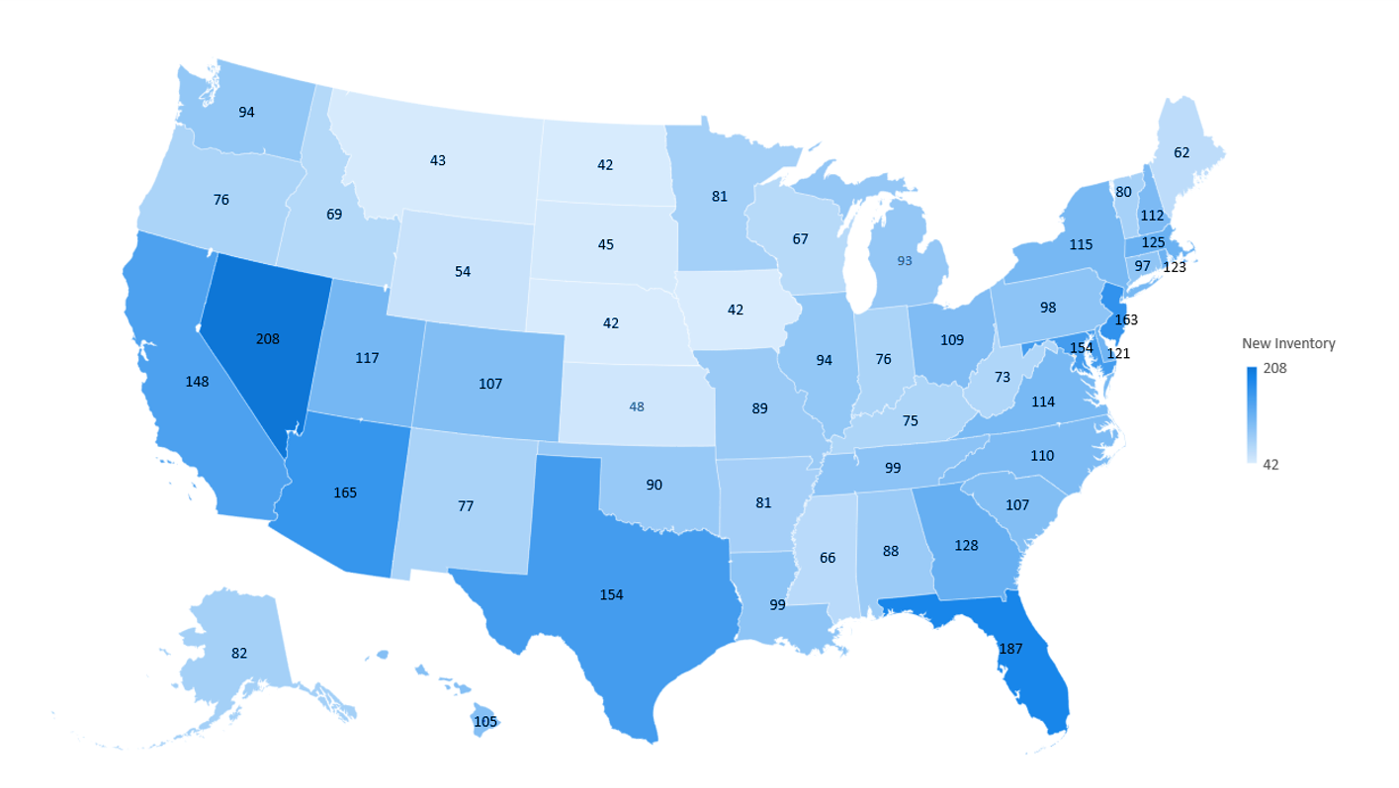
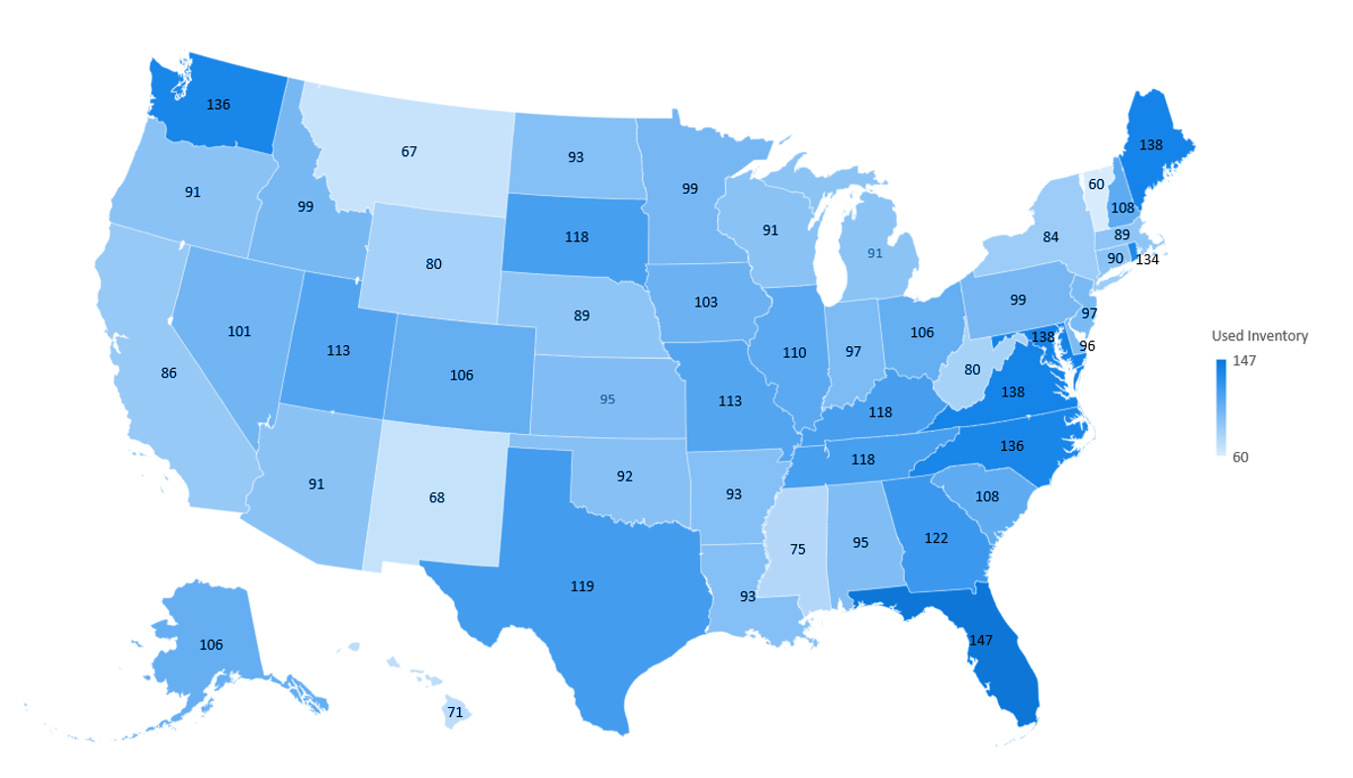
Slicing the data in a different way, we can see how inventory levels varied by state. Dealers in Nevada, Florida, and New Jersey had the most new inventory, while dealers in Florida, Maryland, and Virginia had the most used inventory.
Median New Vehicles Listed on a Dealership’s Website by State
Median Used Vehicles Listed on a Dealership’s Website by State
INVENTORY ACTIVITY
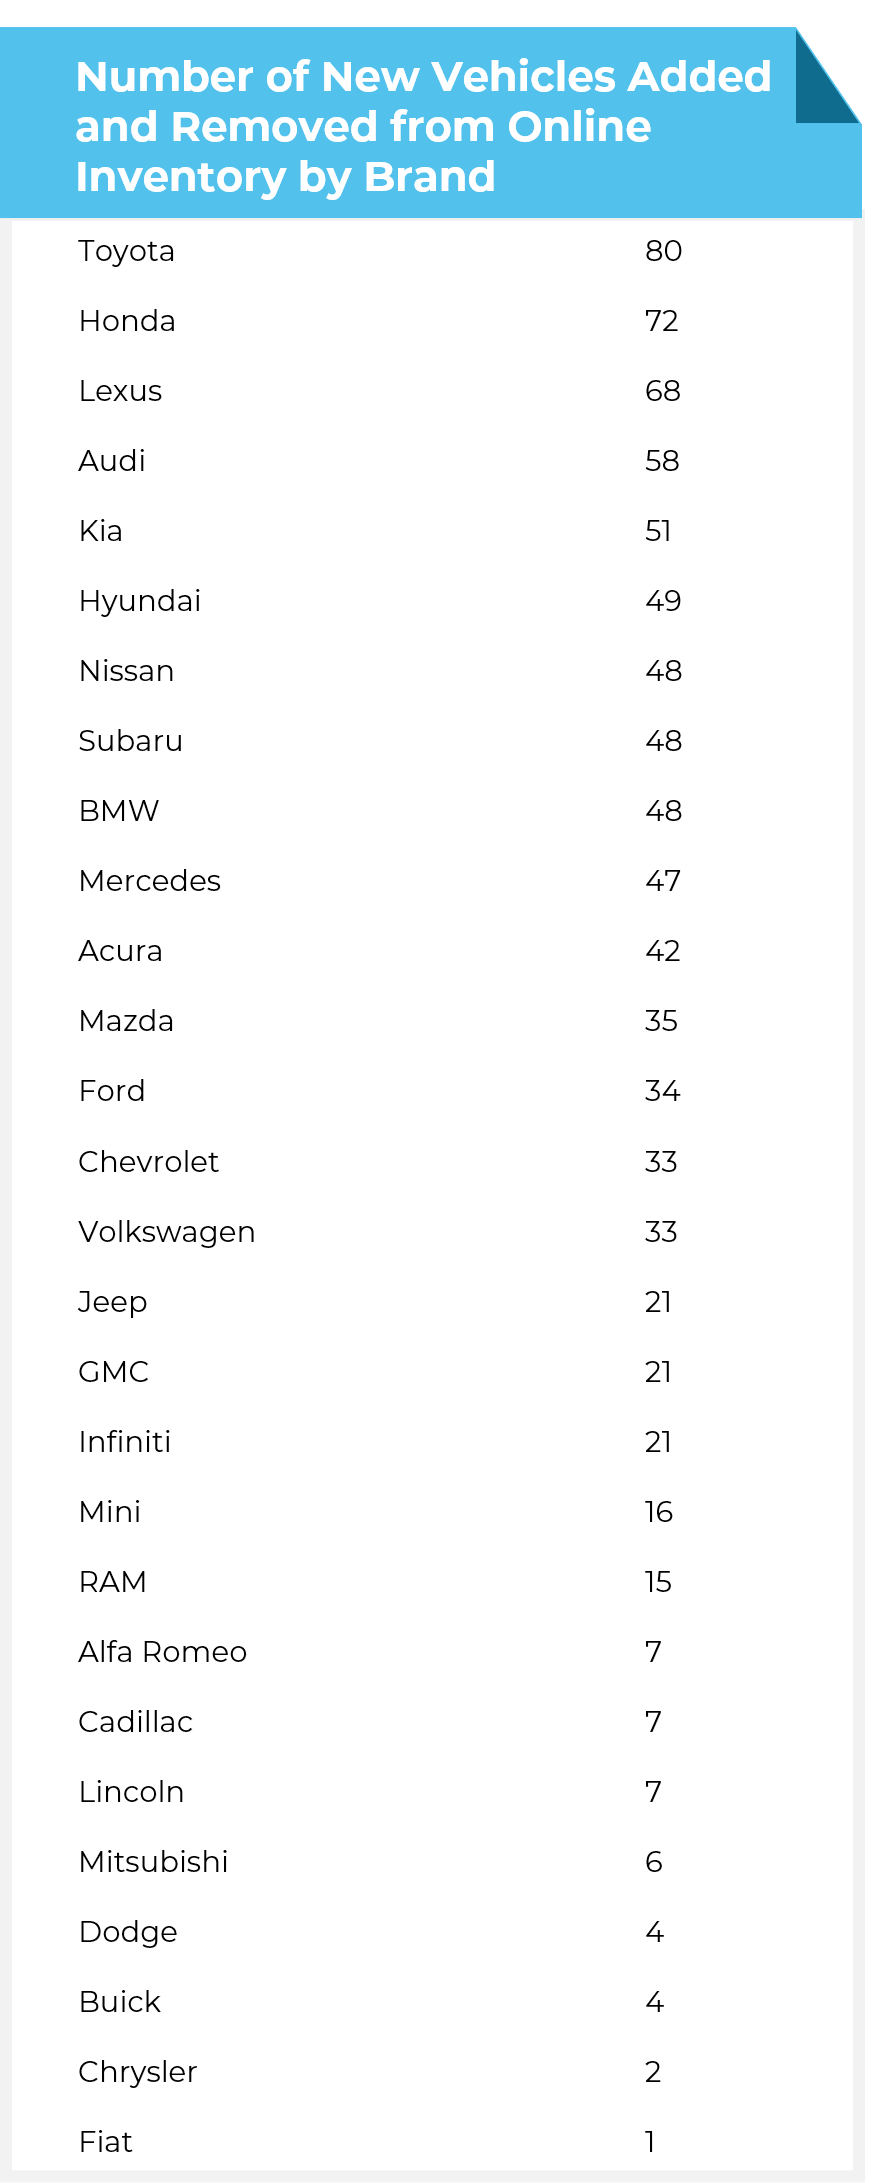
Automotive inventory moves quickly, and 2020 was no exception. The average car dealer added and removed 42 new vehicles and 60 used vehicles from its online inventory each month. Toyota, Honda, and Lexus were among the most active brands, looking at the number of new vehicles added and removed from online inventory.
Inventory Pricing Insights
LISTED PRICE
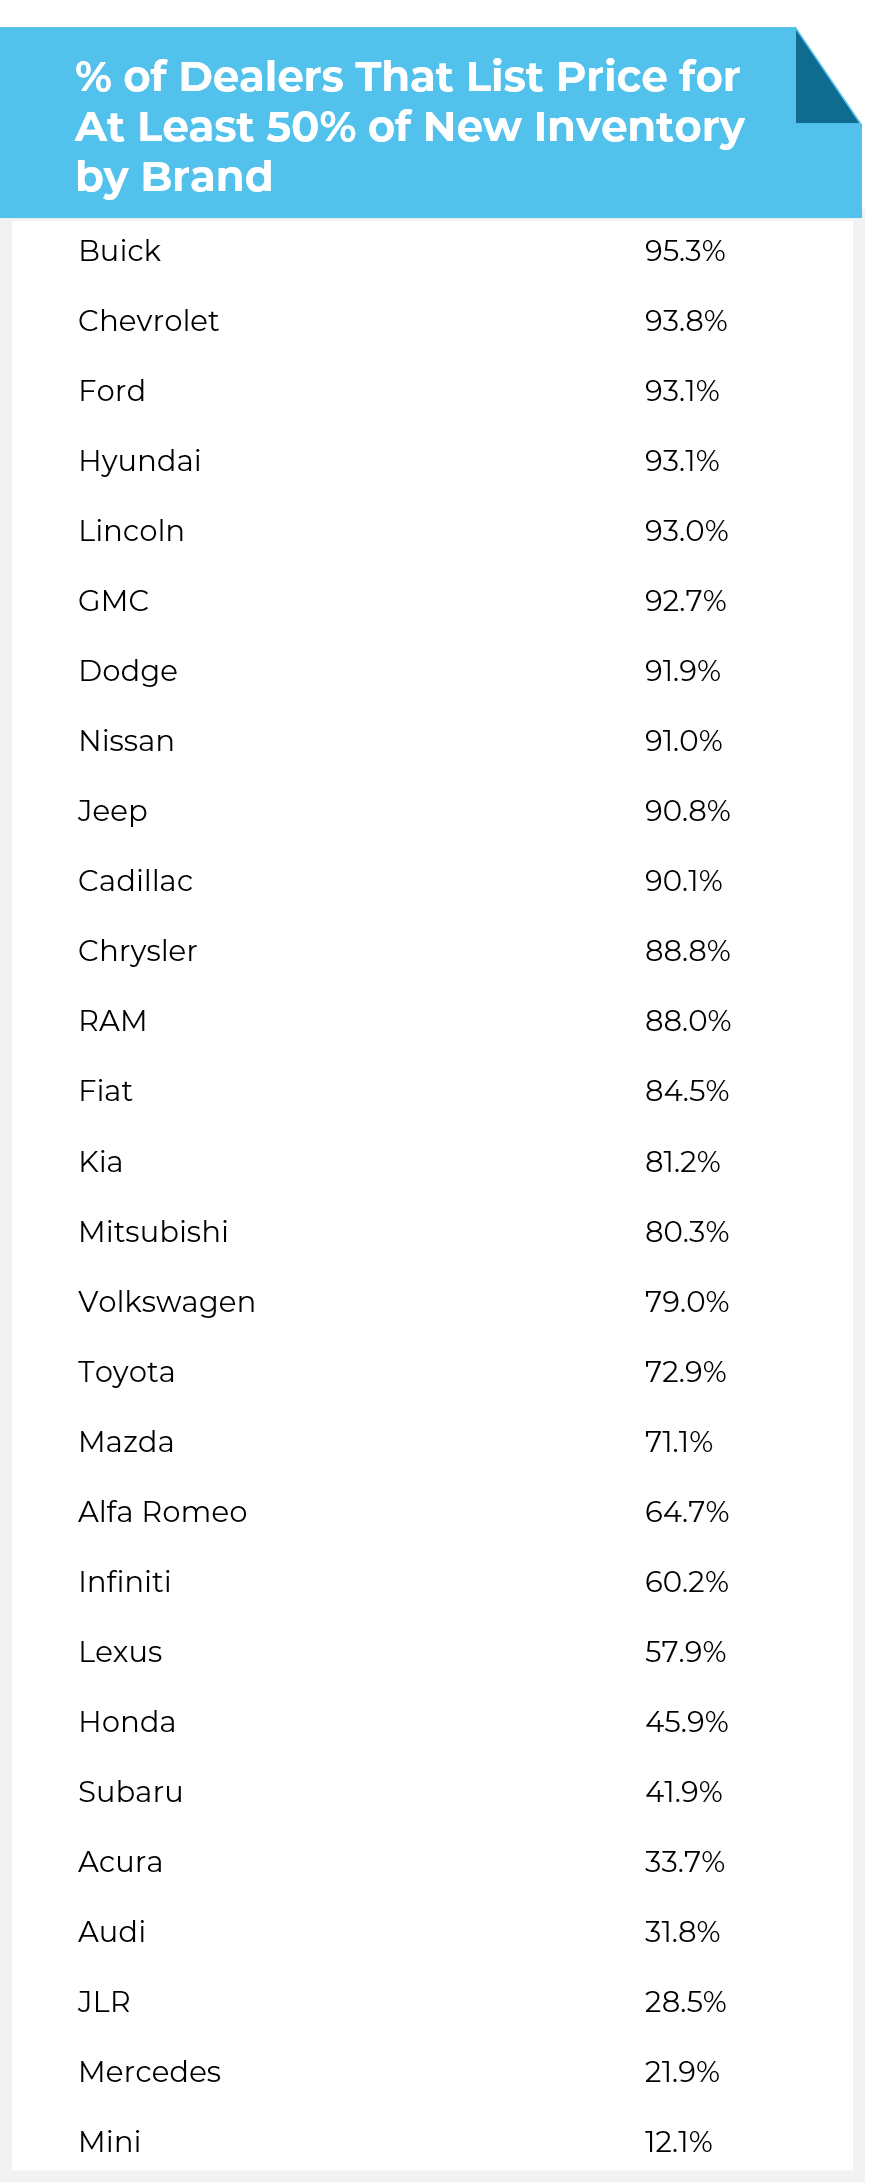
About a quarter of the car dealerships included in the dataset (24%) listed price or conditional price for all online inventory. 78% of dealers listed prices for at least 50% of new inventory, but we were surprised to see that 13% of dealers didn’t list prices for any online inventory.
Looking specifically at the dealerships that list prices for at least half of new inventory online, Buick, Chevrolet, and Ford top the list while Mercedes, Mini, and BMW are at the other end of the spectrum.
PRICE ACTIVITY
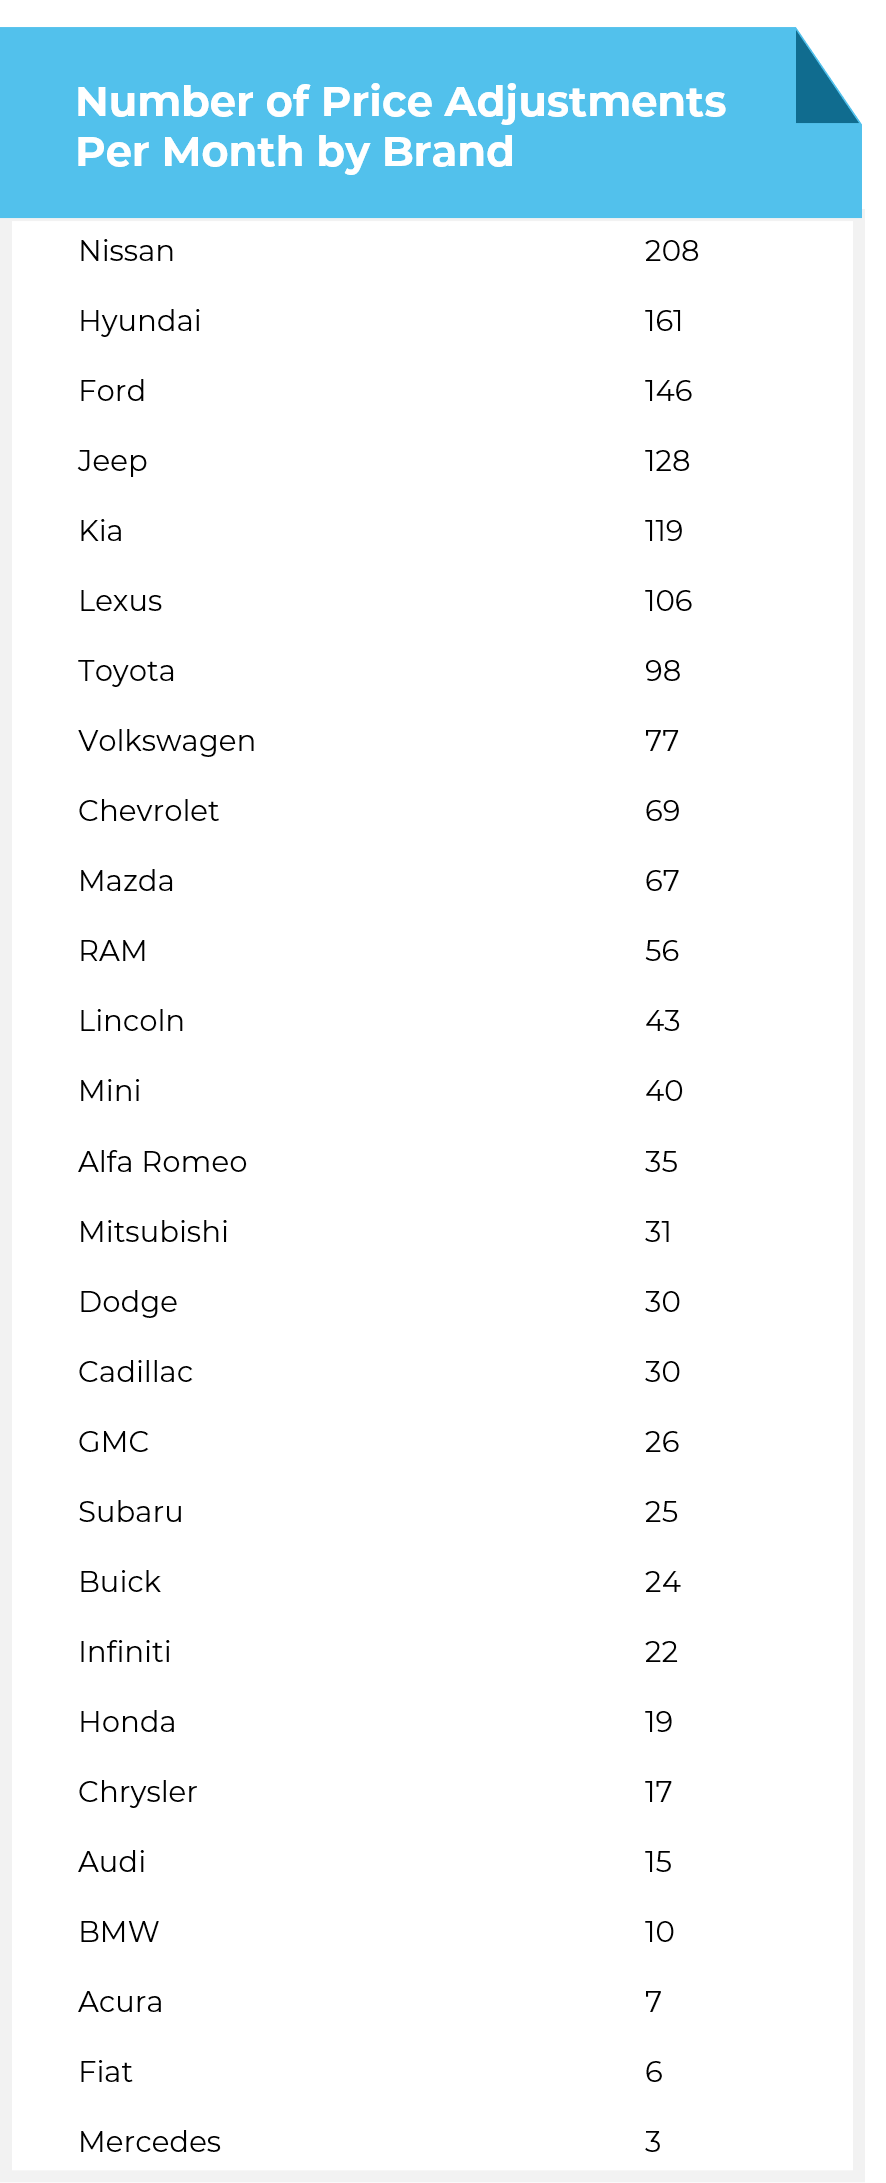
The average car dealership made 103 price adjustments to new inventory and 135 price adjustments to used inventory per month; however, because not all dealerships list prices online, price adjustments happened more or less frequently for different automotive brands.
Nissan was a standout with a median of 208 price adjustments per dealer per month, while Hyundai, Ford, Jeep, Kia, and Lexus all had a median number of price adjustments per dealer per month above 100.
If your dealership is making numerous inventory adjustments throughout the month, make sure you’re using each price drop and new vehicle as an opportunity to engage your most interested car shoppers. Dealerships can get a free trial of Foureyes Prospect Engagement to prove how inventory management data can help to sell more cars.
