For the third year in a row, we’re sharing auto industry benchmarks to help dealers and OEMs understand the market, track changes in customer behavior, and drive sales success in 2021.
This year, we analyzed Foureyes data from December 2019-November 2020, covering more than:
- 350 million website visits
- 25 million unique pieces of inventory
- 19,000 automotive dealership websites
For inventory benchmarks, the median was used to report on trends and key performance indicators for the automotive industry. Inventory data was refreshed in January 2021 to accommodate additional automotive brands.
The sales and marketing insights shared below can be used to guide automotive marketing strategies and help dealers stay competitive. Review inventory, lead management, and sales process benchmarks and download the complete report below.
Inventory Management
Inventory availability has been on everyone’s mind. Automotive inventory levels peaked in April 2020, with a median daily new inventory of 142 and a used inventory of 107. After that, we observed a decline in inventory due to manufacturing and supply chain issues; however, inventory levels have stabilized in recent months. Throughout the rest of this section, we look at inventory numbers from November 2020 as a representation of the current state by dealership location and OEM.
INVENTORY LEVELS
The average car dealer has 108 new vehicles and 103 used vehicles live on its website.
Median Daily New Inventory by Brand | |
Honda | 262 |
Hyundai | 165 |
Subaru | 162 |
Toyota | 162 |
Nissan | 151 |
Audi | 144 |
Acura | 135 |
Kia | 132 |
Lexus | 120 |
BMW | 100 |
Mazda | 98 |
Mercedes | 95 |
Ford | 91 |
Volkswagen | 87 |
Chevrolet | 83 |
Infiniti | 68 |
Jeep | 56 |
RAM | 36 |
GMC | 36 |
Mini | 36 |
JLR | 32 |
Lincoln | 26 |
Cadillac | 25 |
Alfa Romeo | 24 |
Buick | 21 |
Dodge | 12 |
Chrysler | 6 |
Fiat | 3 |
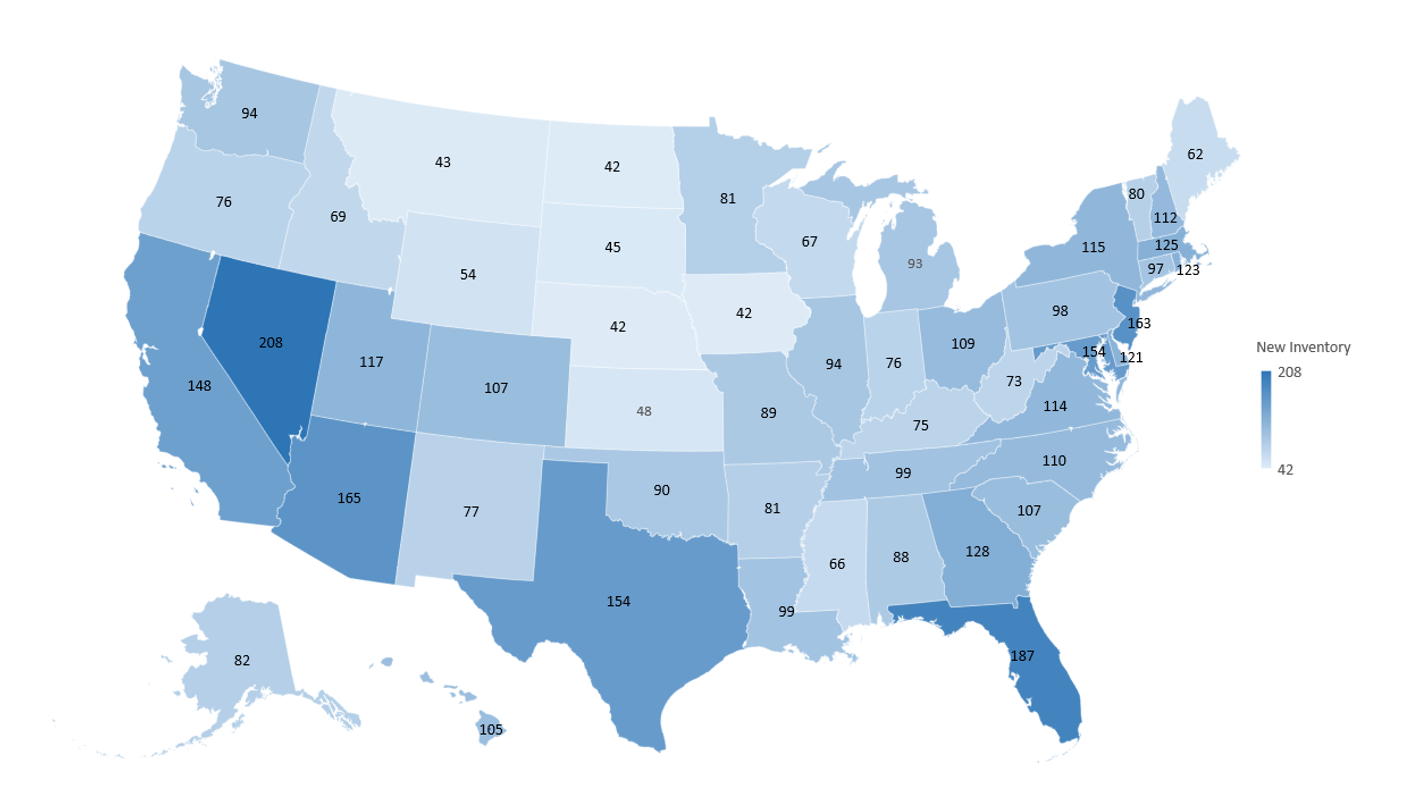
Median New Vehicles Listed on a Dealership’s Website by State
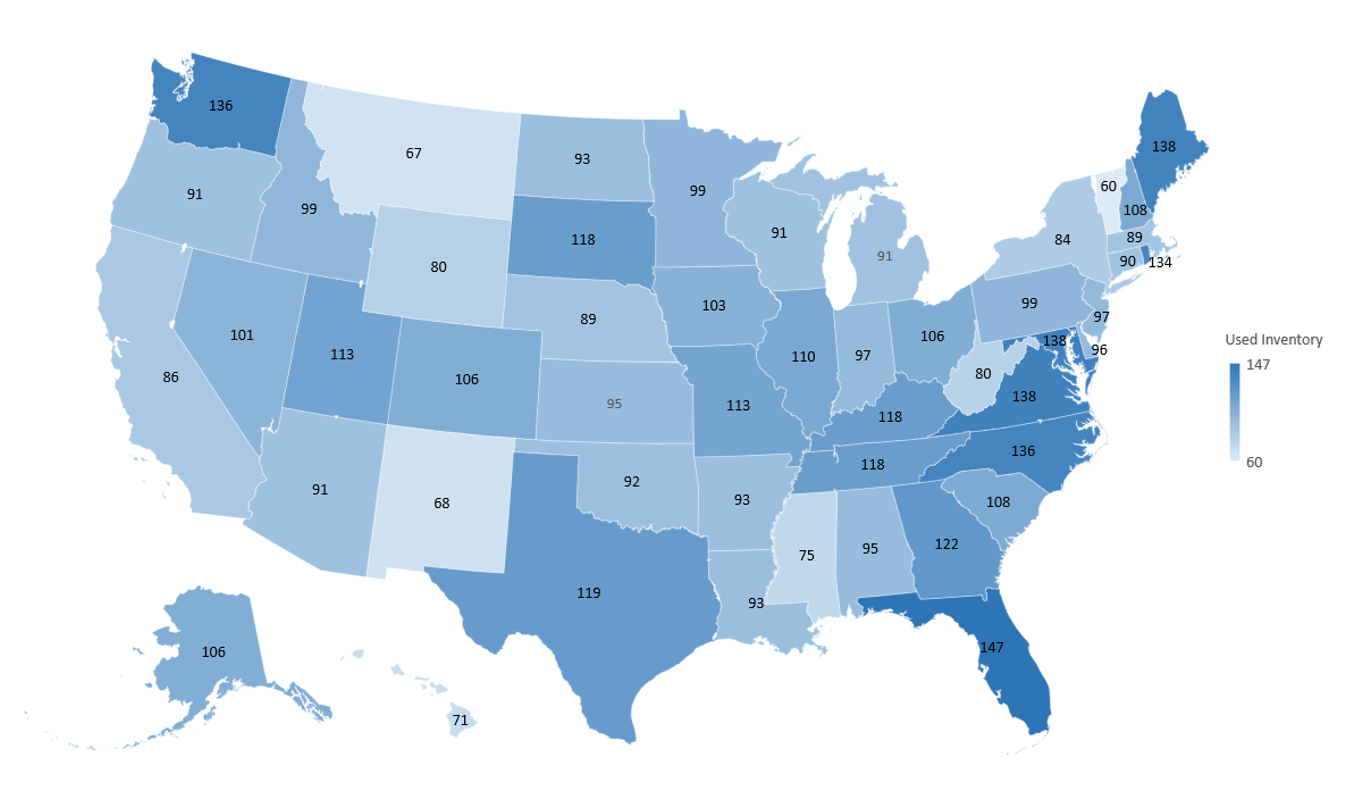
Median Used Vehicles Listed on a Dealership’s Website by State
INVENTORY CHANGES
Automotive inventory moves quickly, and the average car dealer adds and removes 42 new vehicles and 60 used vehicles from their online inventory each month.
Number of New Vehicles Added & Removed from Online Inventory by Brand | |
Toyota | 80 |
Honda | 72 |
Lexus | 68 |
Audi | 58 |
Kia | 51 |
Hyundai | 49 |
Nissan | 48 |
Subaru | 48 |
BMW | 48 |
Mercedes | 47 |
Acura | 42 |
Mazda | 35 |
Ford | 34 |
Chevrolet | 33 |
Volkswagen | 33 |
Jeep | 21 |
GMC | 21 |
Infiniti | 21 |
Mini | 16 |
RAM | 15 |
Alfa Romeo | 7 |
Cadillac | 7 |
Lincoln | 7 |
Mitsubishi | 6 |
Dodge | 4 |
Buick | 4 |
Chrysler | 2 |
Fiat | 1 |
PRICING
When it comes to price, only 24% of car dealerships list price or conditional price for all of their online inventory. 78% of dealers list prices for at least 50% of new inventory, while 13% of dealers don’t list prices online for any vehicles.
% of Dealers That List Price for At Least 50% of New Inventory by Brand | |
Buick | 95.3% |
Chevrolet | 93.8% |
Ford | 93.1% |
Hyundai | 93.1% |
Lincoln | 93.0% |
GMC | 92.7% |
Dodge | 91.9% |
Nissan | 91.0% |
Jeep | 90.8% |
Cadillac | 90.1% |
Chrysler | 88.8% |
RAM | 88.0% |
Fiat | 84.5% |
Kia | 81.2% |
Mitsubishi | 80.3% |
Volkswagen | 79.0% |
Toyota | 72.9% |
Mazda | 71.1% |
Alfa Romeo | 64.7% |
Infiniti | 60.2% |
Lexus | 57.9% |
Honda | 45.9% |
Subaru | 41.9% |
Acura | 33.7% |
Audi | 31.8% |
JLR | 28.5% |
Mercedes | 21.9% |
Mini | 12.1% |
BMW | 4.4% |
PRICE CHANGES
Throughout the month, the average car dealership makes 103 price adjustments to new inventory and 135 price adjustments to used inventory; however, because not all automotive brands or dealerships list prices online, price adjustments happen more frequently for certain OEMs.
Number of Price Adjustments Per Month by Brand | |
Nissan | 208 |
Hyundai | 161 |
Ford | 146 |
Jeep | 128 |
Kia | 119 |
Lexus | 106 |
Toyota | 98 |
Volkswagen | 77 |
Chevrolet | 69 |
Mazda | 67 |
RAM | 56 |
Lincoln | 43 |
Mini | 40 |
Alfa Romeo | 35 |
Mitsubishi | 31 |
Dodge | 30 |
Cadillac | 30 |
GMC | 26 |
Subaru | 25 |
Buick | 24 |
Infiniti | 22 |
Honda | 19 |
Chrysler | 17 |
Audi | 15 |
BMW | 10 |
Acura | 7 |
Fiat | 6 |
Mercedes | 3 |
JLR | 3 |
Lead Management
Do you know where your leads are really coming from? Foureyes filters out bots, solicitors, job seekers, service customers, and other non-sales leads to provide clear insight into lead generation and management benchmarks for dealers across the country.
To report on true sales opportunities and accurate attribution data, the insights below distinguish between:
- Visitors to your website who may or may not have completed a lead action
- Leads who have called, filled out a form, or chatted
- Qualified sales leads who are confirmed to be in the market to purchase a vehicle, with service and other non-sales leads filtered out
- Sold leads that have completed the sales process and purchased a vehicle
LEAD TRACKING
Distinguishing between leads, qualified sales leads, and sales can help you spot trends and determine where your best leads come from.
- 3.2% of website visitors convert into leads
- The average lead views 4.8 VDPs
- The average qualified sales lead views 8.7 VDPs
- The average sold lead views 11.4 VDPs before the sale
Lead Source by Channel | |||
Leads | Qualified Sales Leads | Sales | |
Organic | 38.6% | 36.3% | 33.9% |
Direct | 26.1% | 28.0% | 33.9% |
Paid | 22.3% | 18.6% | 19.0% |
Referral | 7.9% | 10.4% | 9.1% |
2.3% | 3.7% | 2.6% | |
Social | 2.8% | 3.0% | 1.5% |
LEAD ACTIONS
Without this separation, you also risk not knowing which lead actions are actually the most common and valuable for sales. For example, if you just look at leads:
- 59.0% of leads call
- 31.6% of leads fill out a form
- 9.4% of leads chat
At a glance, phone calls seem to be your best lead source. But when you filter out bots, wrong numbers, service inquiries, and other non-sales leads, the data tells a different story.
- 63.9% of qualified sales leads fill out a form
- 21.0% of qualified sales leads call
- 15.1% of qualified sales leads chat
More qualified sales leads come from forms than phone calls, a trend that continues if you look at sales and each customer’s original lead action.
- 63.8% of sold leads fill out a form
- 24.2% of sold leads call
- 12.0% of sold leads chat
Sales Process
Sales process impacts lead engagement and conversion more than you may realize. As car shopping increasingly moves online and digital retailing becomes part of the new normal, clear lead handling can help ensure you’re maximizing each sales opportunity in your pipeline. Here is your glimpse into sales process benchmarks and close rates across the country.
LEAD GENERATION
The average car dealership generates 278 leads per month, but when you filter out non-sales leads and confirm buying intent, the average car dealership actually generates 114 qualified sales leads each month.
Lead Generation by Dealership Type | ||
Luxury | 236 leads/month | 91 qualified sales leads/month |
Small (less than 7,500 website sessions/month) | 112 leads/month | 47 qualified sales leads/month |
Medium (7,501-15,000 website sessions/month) | 205 leads/month | 86 qualified sales leads/month |
Large (more than 15,001 website sessions/month) | 442 leads/month | 191 qualified sales leads/month |
CLOSE RATE
The close rate of qualified sales leads at the average dealership is 12.4%.
Average Close Rate by Dealership Type | |
Luxury | 14.1% |
Small (less than 7,500 website sessions/month) | 11.7% |
Medium (7,501-15,000 website sessions/month) | 12.7% |
Large (more than 15,001 website sessions/month) | 12.3% |
LEAD FOLLOW UP
On an average day, 57.6% of the qualified sales leads who are shopping your website are return visitors.
- Among call leads, 48.2% are return visitors and 51.8% are new
- Among form leads, 59.7% are return visitors and 40.3% are new
- Among chat leads, 52.7% are return visitors and 47.3% are new
Leads may continue shopping long after you’ve marked them ‘lost.’ When a returning lead is active on a car dealership’s website, but no follow-up activity is recorded in the CRM within 24 hours of the visit, they’re considered flagged.
38.9% of the average dealership’s qualified sales leads are flagged.
- 34.5% of call leads are flagged
- 39.3% of form leads are flagged
- 32.9% of chat leads are flagged
That means almost half of automotive sales leads are showing interest and not receiving timely follow-up from your team!
Of the 38.9% of leads that are flagged:
- 13.9% do not receive follow-up within 24 to 48 hours
- 21.1% do not receive follow-up within 48 hours to 1 week
- 65.0% do not receive follow-up after 1 week or longer
LOST LEADS
Even worse than losing opportunities to engage leads who are actively shopping online? Losing them completely from your pipeline.
8.7% of calls from qualified sales leads are missed. For the calls that are answered, the median hold time for leads is 71 seconds.
For the average car dealer, 10.6% of website leads (calls + forms + chats) are never logged in the CRM.
% of Website Leads That Aren’t Logged in The CRM by Lead Source | |
Calls | 26.0% |
Forms | 7.0% |
Chats | 2.3% |
Fix this problem with Foureyes Safety Net
MISHANDLED LEADS
Altogether—46.7% of the average dealership’s qualified sales leads are mishandled (meaning they’re missed, flagged, or aren’t logged in the CRM).
% of Qualified Sales Leads That Are Mishandled by Lead Source | |
Calls | 56.3% |
Forms | 43.9% |
Chats | 34.7% |
Beat These Benchmarks
The good news? You can address lead handling and sales process issues to keep sales from slipping through cracks in your pipeline. Foureyes sales intelligence software was built to help businesses track, protect, engage, and sell better. With user-level tracking, inventory-based communication, sales enablement alerts, and a safety net for your CRM, Foureyes has data-driven products to power your sales.
Sign up for a 60-day free trial or reach out to our sales team to learn more.
Curious how previous years compare? Review the 2020 Automotive Benchmarks and 2019 Automotive Benchmarks.