There’s a lot of buzz in the automotive industry about inventory levels and the desperation dealers are feeling. Seeing that much of the available content was quotes, we thought a view of the data may be helpful to quantify the problem.
Foureyes collects data from more than 18,000 new car franchise dealership websites each day. Since the coronavirus outbreak, we’ve been monitoring auto sales and inventory levels across the country to share how the pandemic has impacted the auto industry.
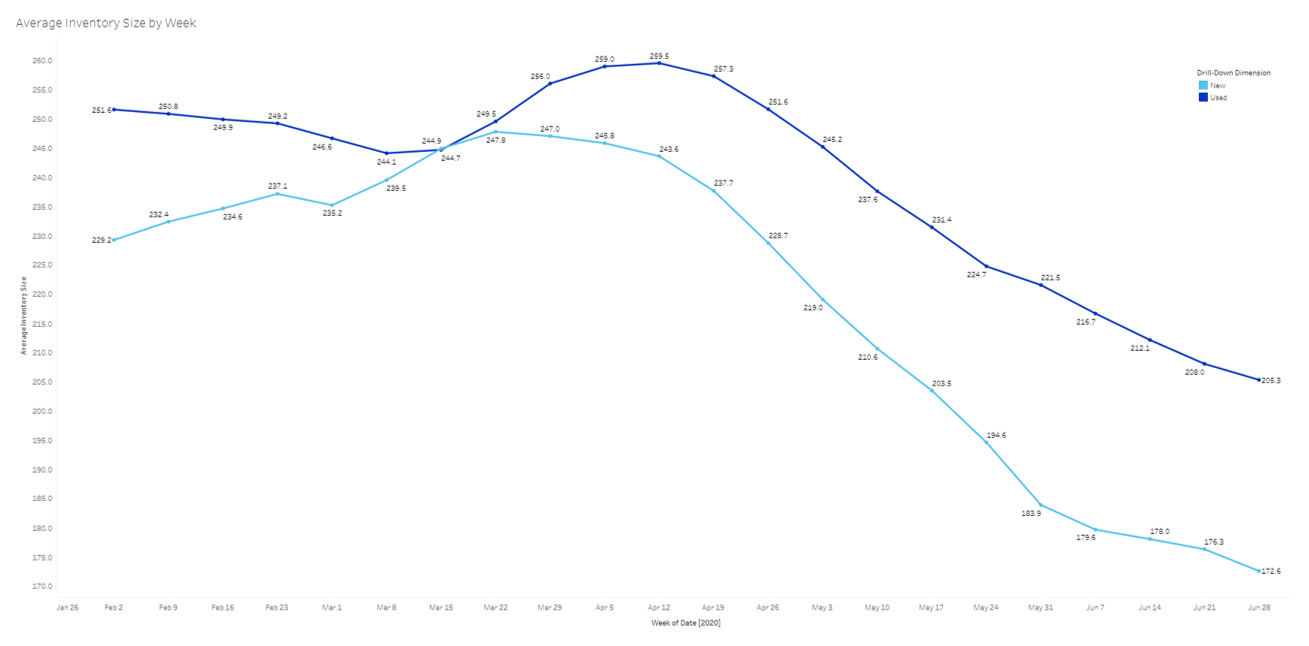
As you can see in the graph below, (no surprise) average inventory size has dropped drastically since March. New inventory was at its peak the week of March 22, but the amount of new inventory that the average dealer has on its lot steadily decreased in the weeks following. Used inventory followed a similar downward trend since its peak the week of April 12. Comparing the week of June 28 to each respective high, new inventory has decreased by (-30.42%) and used inventory has decreased by (-21.04%).

New Car Inventory Surpassed Truck Availability for the First Time
To understand what vehicles were more or less available as inventory levels dropped across the country, we further segmented the data by condition and body type. From February through June, there were a few notable shifts.
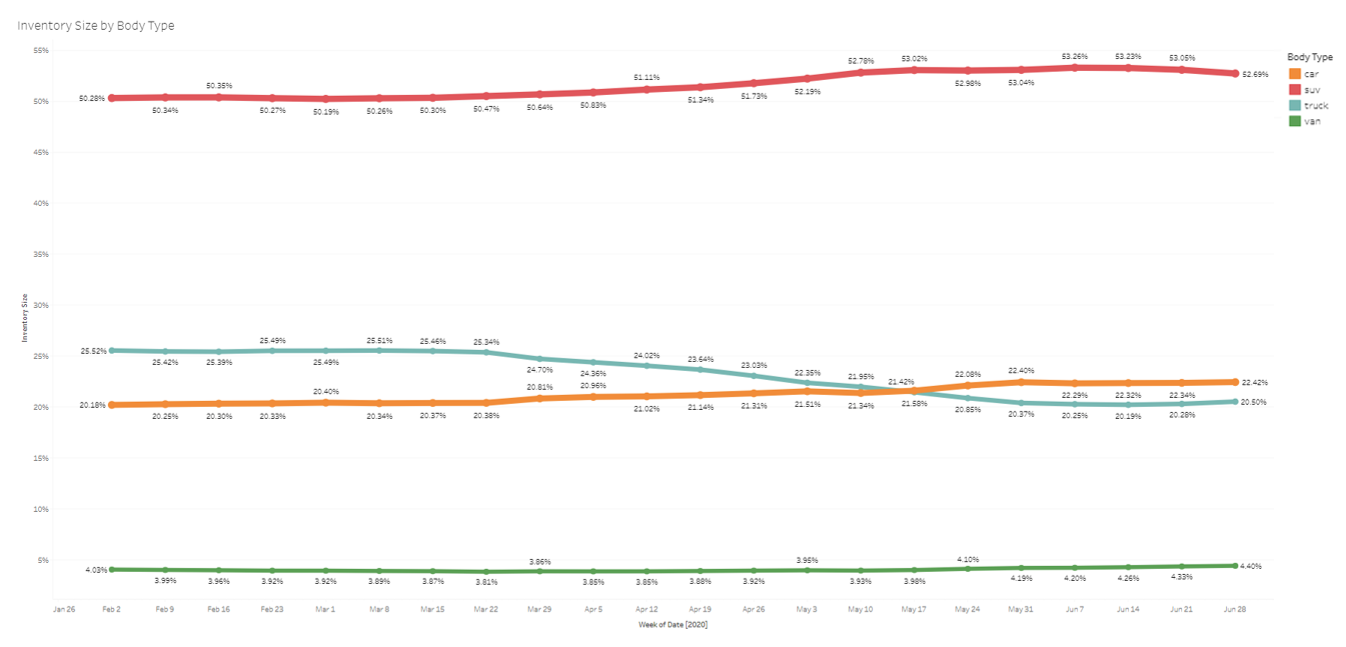
Looking at new inventory by body type, truck inventory declined faster and new car inventory declined slower than other segments, so proportionally they switched places. From the week of February 2 through the week of March 22, cars made up (20.32%) of new inventory on average, while trucks made up (25.45%) on average. Between March 29 and May 10, cars increased to (21.16%), while trucks dropped to (23.44%) of new inventory. By the week of May 17, there was more new car inventory (21.58%) than new truck inventory (21.42%) for the first time. These opposing trends continued through the end of June. From May 17 through the week of June 28, cars made up (22.20%) of new inventory on average and trucks made up (20.55%).

Used SUVs Outnumber New Models
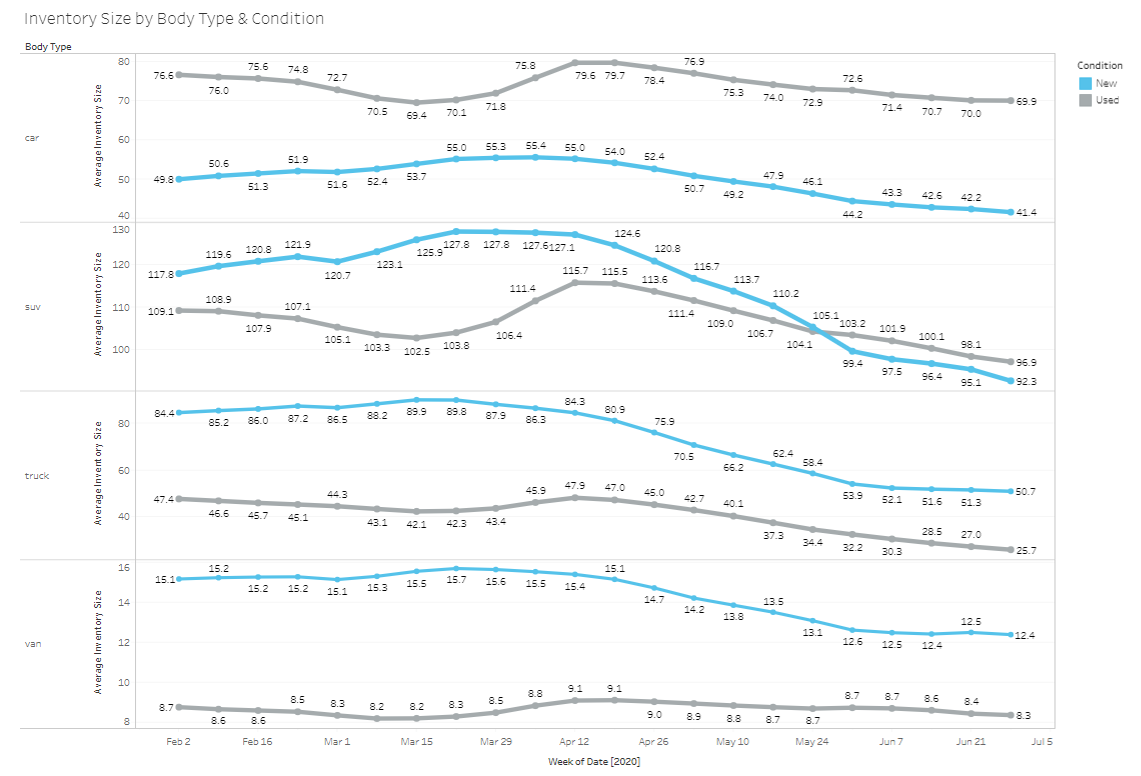
Another notable shift happened for SUVs. While new inventory levels were higher than used during February, March, and April, in May new SUV inventory began to decline at a faster rate. By the week of May 31, the average dealer had more used SUVs on its lot than new. Throughout June, the relative availability of used SUVs has continued to outpace new models.

Before this, cars were the only body type for which used inventory has historically been higher on average than new. SUVs ended up in the same position just in the past couple months, and although the faster decline of new inventory compared to used is most apparent with SUVs, it is also seen among cars, trucks, and vans. This trend is consistent with the experience of many of the dealers we talk to who say they are prioritizing used inventory and fixed ops to offset new car sales losses.

The Road Ahead
Looking at the data available, it’s unlikely that we’ve reached the low point in inventory levels. While inventory availability continues to be top of mind for the auto industry, we’ll continue to monitor nationwide trends and report updates or notable shifts as they happen.
To stay in the loop and be the first to receive data releases and reports, sign up for updates below.
