We recently hosted a webinar to unpack more than 56 different automotive benchmarks and what they tell us about the state of automotive retail in 2021.
At Foureyes, we strongly believe that good data doesn’t answer questions, it asks better questions. When we released our annual benchmarks report, the data sparked numerous other questions and insights that we wanted to dive into as part of this webinar. You can review the information discussed below or fill out the form to watch the complete recording.
Pulling from a unique dataset of more than 19,000 automotive dealership websites across the country, spanning 350 million website visits and 25 million unique pieces of inventory, here’s what the data tells us about car shoppers and dealer competition today.
Inventory Management
MORE INVENTORY ≠ MORE SALES
Looking at inventory levels from November 2020, the average dealership had 108 new vehicles and 103 used vehicles in its online inventory. But when you break it down by brand, you can see that Honda is well above the other brands with a median daily inventory of 262 new vehicles per dealer.
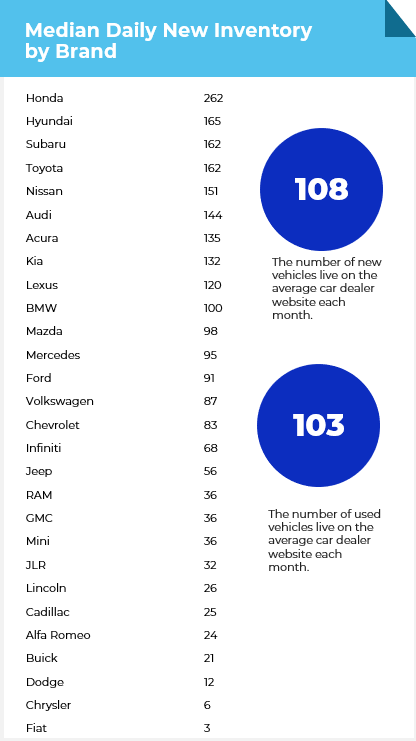
Toyota has the fourth highest amount of new inventory with a median of 162 new vehicles, but when you break the inventory levels down by type it starts to get interesting.
Toyota | Nov 2020 | April 2020 | Delta |
Median Daily Inventory | 162 | 202 | -20% |
SUV | 70 | 78 | -10% |
Car | 66 | 65 | 2% |
Van | 3 | 3 | 0% |
Truck | 18 | 48 | -63% |
Toyota’s truck inventory dropped by -63% when comparing April 2020 to November 2020 inventory levels. This dip in truck inventory was a big part of why Toyota’s new inventory levels dropped -20% in that same timeframe.
Nissan is similar to Toyota with a diverse mix of models, and when you look at its inventory during the same time period, new inventory levels dropped by -31% between April and November 2020, largely driven by a -45% decrease in SUV inventory. Interestingly, Nissan’s truck inventory actually increased +31% when comparing April to November 2020.
Nissan | Nov 2020 | April 2020 | Delta |
Median Daily Inventory | 151 | 218 | -31% |
SUV | 65 | 118 | -45% |
Car | 61 | 75 | -19% |
Van | 4 | 6 | -33% |
Truck | 17 | 13 | 31% |
If we dive deeper into some of the backend data to compare inventory levels to sales data, we can see that Toyota maintained about 12.5% market share over the past year. Even with less inventory on dealer lots, it was able to maintain sales and hold its own with regard to market share.
If we take a look at Honda, this brand is actually an exception. Honda’s inventory numbers went up during 2020; however, its market share decreased from 11.7% to 9.6% during that same time. Despite increasing inventory, its share of sales went down.
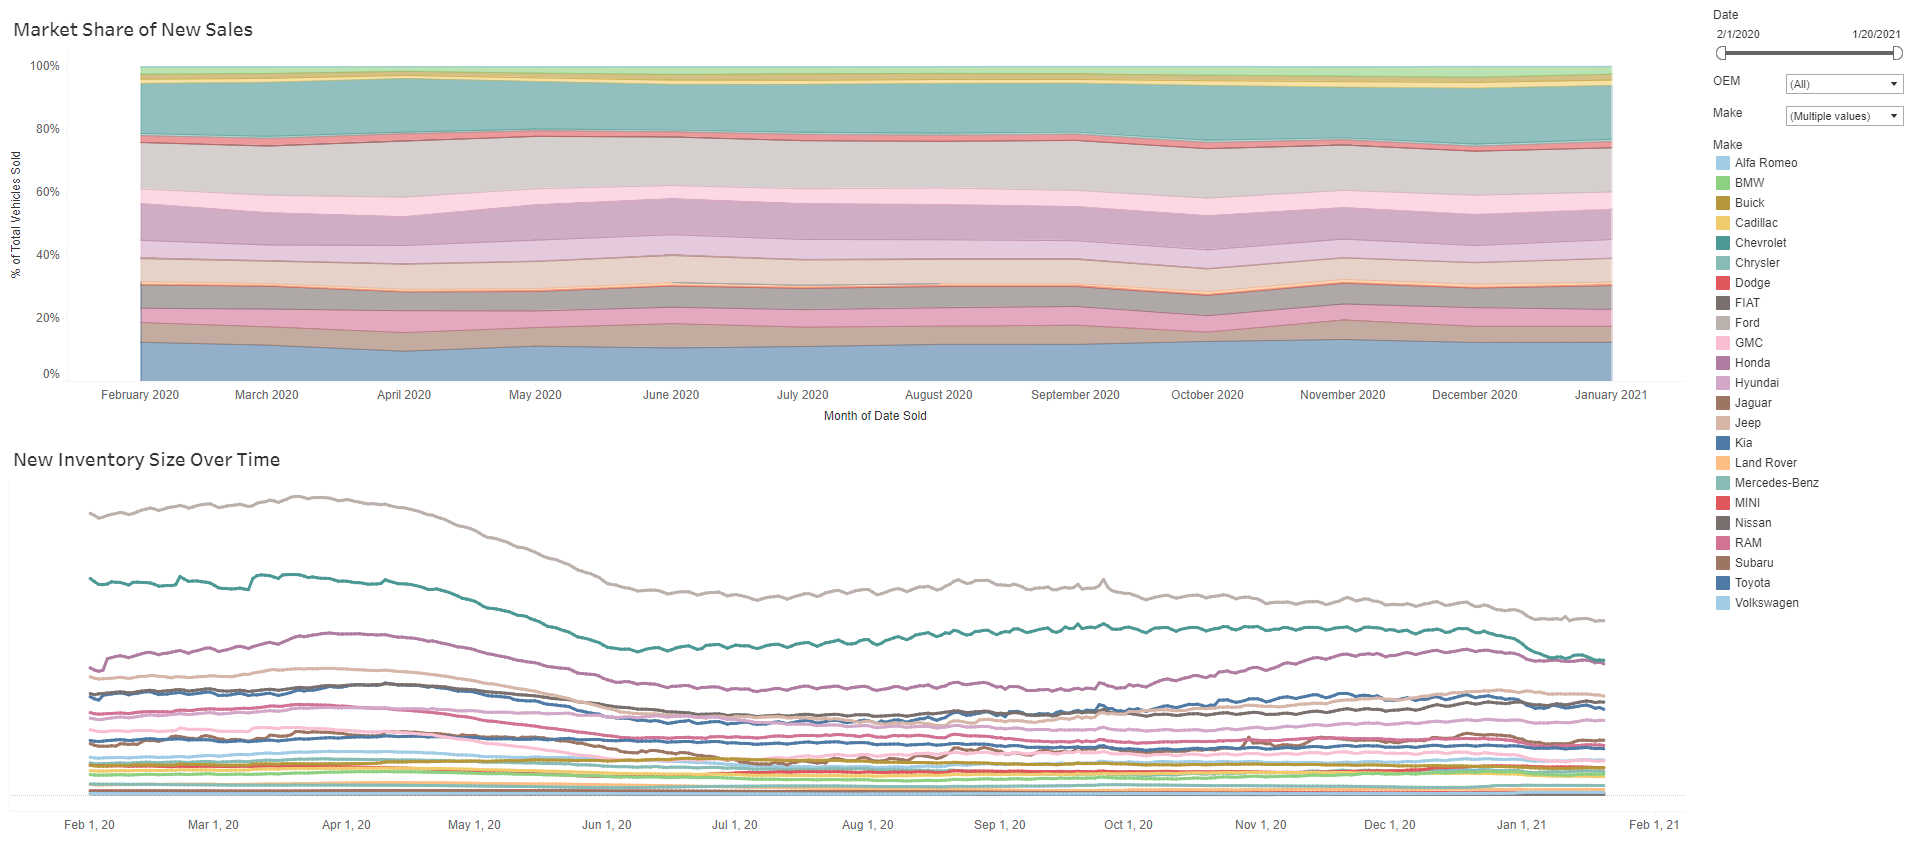
Chevrolet saw a similar decrease in inventory over 2020, but its market share also increased—moving from 15.8% to 17% during that time, even as Chevy inventory dropped by ~167,000 units.
Looking at RAM, it saw a significant decrease in inventory as well, but its market share increased from 4.5% to 5.4% during that same time.
What’s interesting about this is that in automotive there’s a prevailing belief that to sell a lot of vehicles, you have to have a lot of inventory. These data to show that that’s not necessarily the case. At a time when everyone was worried about diminishing inventory supply, the automotive brands that had the most inventory didn’t actually have better sales. This seems to be a testament that dealers have learned how to sell the same amount of vehicles even with less inventory. Over this next year or so we’ll be keeping an eye on this trend and whether it will continue in a post-COVID world as well.
LISTING PRICE ONLINE MAY HELP SALES
When we initially pulled the pricing benchmark data, we were surprised with the results. After the ups and downs of 2020, with low inventory levels and a quick transition to digital retailing, these benchmarks are very positive.
78% of dealers list prices for more than half of online inventory. By brand, we were impressed to see domestic brands like Buick, Chevy, and Ford with more than 90% of dealers listing prices for more than 50% of new inventory online. When it comes to transparent online pricing, Toyota, Honda, and Subaru are falling behind other mass-market automotive brands.
Taking a deeper dive into the top eight brands that display pricing for 50% or more of online inventory, you can see that almost half of Buick dealers list prices for all online inventory and only 3% of Buick dealers don’t list any prices online.
Brand | % of Dealers That List Price for At Least 50% of New Inventory Online | % of Dealers That List Price for All Online Inventory | % of Dealers That Don’t List Price for Any Inventory Online |
Buick | 95.3% | 47.9% | 2.9% |
Chevrolet | 93.8% | 18.9% | 1.6% |
Ford | 93.1% | 29.4% | 3.5% |
Hyundai | 93.1% | 24.9% | 2.7% |
Lincoln | 93.0% | 73.5% | 4.8% |
GMC | 92.7% | 22.4% | 2.3% |
Dodge | 91.9% | 68.1% | 4.9% |
Nissan | 91.0% | 35.8% | 4.7% |
Across brands, we know that there’s always going to be inventory listed without a price—sometimes intentionally, and sometimes unintentionally. It’s never going to be perfect that 100% of dealers list prices online, but it is concerning to see that 13% of dealers don’t list any prices online. When we dig into which auto brands are among the least transparent with their online pricing, it’s surprising to see that 4 in 10 Honda dealers don’t list prices for online inventory. And Subaru isn’t far behind—37% of Subaru dealers don’t list prices for any online inventory.
Brand | % of Dealers That Don’t List Price for Any Inventory Online |
Honda | 40% |
Subaru | 37% |
Toyota | 18% |
Study Average | 13% |
I’m curious if a high amount of activity around inventory is what’s causing vehicles to be listed online without a price. It’s something for OEMs to think about, especially for automotive brands that see transparent pricing as a way to engage customers and encourage them to inquire about specific inventory. These benchmarks could point to a larger problem if we’re seeing new inventory go live without pricing, and then we’re seeing that inventory sit on the lot (and website) longer.
It could also indicate that customers want and even expect price transparency online. As digital retailing becomes more common in automotive, customers may expect to find all the information they’re looking for online and not understand why they need to take an additional step to get the price of a vehicle at one dealership when they can easily find that information at another brand or competitor.
PRICE CHANGES CAN BE USED TO ENGAGE LEADS
Digging into pricing a bit more, let's look at the number of price adjustments dealers are making to online inventory. On average, dealers are making 103 price adjustments to new inventory and 135 price adjustments to used inventory per month. As a note, these numbers do not include new vehicles that are added to online inventory. It’s only counted as a change if the listed price online increases or decreases.
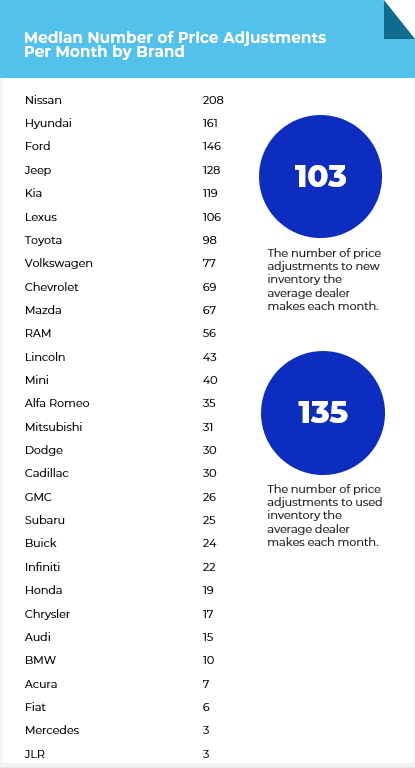
Breaking the data down by brand, Nissan stands out with a median of 208 price adjustments per dealer per month. Dealers that are making numerous pricing changes per month should consider how customers are finding out about these changes.
If you’re frequently changing prices, you have a great reason to communicate with prospective buyers. Don’t leave it up to them to return to your website and notice the new price. Make sure you’re fully leveraging the price adjustments you’re making throughout the month to communicate with prospective customers and give them a reason to come back to your website and engage with your dealership.
Lead Handling
THE DIFFERENCE BETWEEN LEADS AND QUALIFIED SALES LEADS
On average, 3.2% of website visitors convert into leads. But one of the big problems in automotive is that the term ‘lead’ is too often used to refer to anyone who fills out a form, chats, or calls—including wrong numbers, bots, solicitors, service leads, and other non-sales inquiries. That’s why in our data we distinguish between leads, qualified sales leads, and sold leads:
- Leads are any website visitors who have called, filled out a form, or chatted
- Qualified sales leads are just the leads who are confirmed to be in the market to purchase a vehicle, with service and other non-sales leads filtered out
- Sold leads are former leads that have completed the sales process and actually purchased a vehicle
When we break the lead pool up like this, you can begin to see how differently these visitors behave on a car dealer’s website:
- The average lead views 4.8 VDPs
- The average qualified sales lead views 8.7 VDPs
- The average sold lead views 11.4 VDPs before the sale
How qualified sales leads contact the dealership also varies:
- 59.0% of leads call
- 31.6% of leads fill out a form
- 9.4% of leads chat
- 63.9% of qualified sales leads fill out a form
- 21.0% of qualified sales leads call
- 15.1% of qualified sales leads chat
More qualified sales leads come from forms than phone calls, a trend that’s confirmed if you look at sales data and each customer’s original lead action:
- 63.8% of sold leads fill out a form
- 24.2% of sold leads call
- 12.0% of sold leads chat
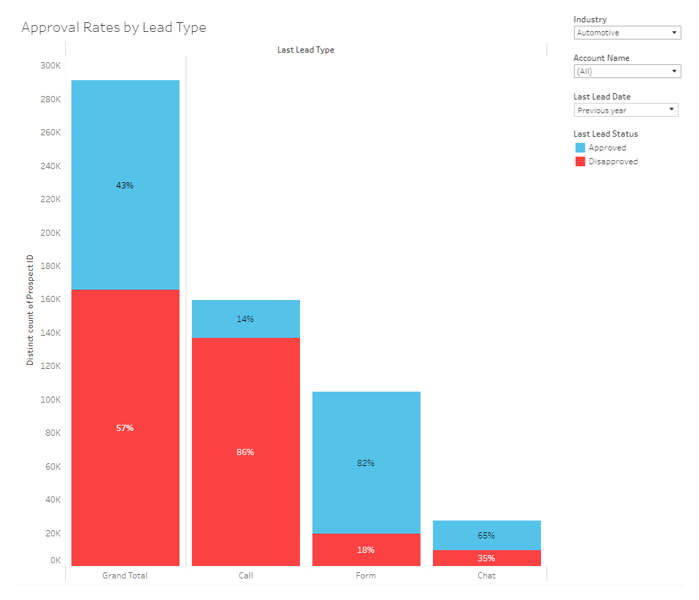
In fact, looking at the data, 86% of calls to a dealership are not sales-related. Only 14% can be considered sales calls. On the other hand, 82% of form completions and 65% of chats are relevant to sales.
THE MOST VALUABLE LEAD GENERATION CHANNELS
So where are these qualified sales leads coming from? Organic, direct, and paid traffic are still the biggest drivers of qualified sales leads. Social media has evolved as a lead generation channel, especially with recent advancements in Facebook and YouTube ads, but overall social media is still not a major channel for qualified sales leads.
Lead Source by Channel | Qualified Sales Leads |
Organic | 38.6% |
Direct | 26.1% |
Paid | 22.3% |
Referral | 7.9% |
Social | 2.8% |
2.3% |
DEALER WEBSITES DROVE MORE QUALIFIED SALES LEADS IN 2020 THAN 2019
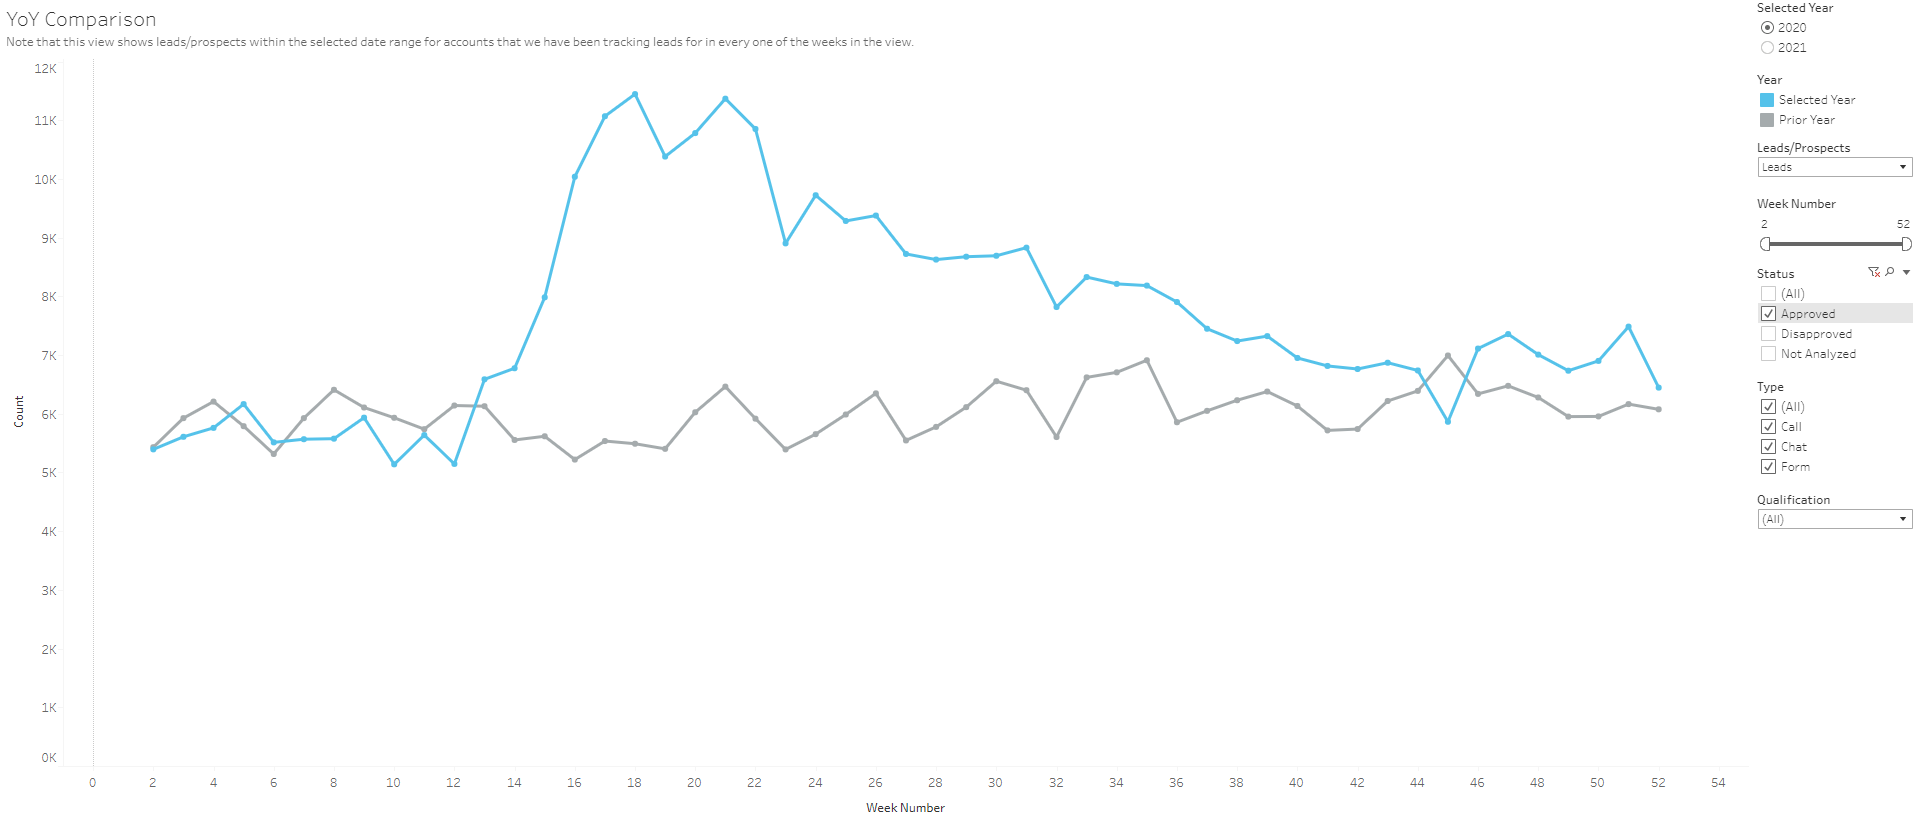
Because we release the benchmarks report annually, a big question we had in our minds this year was how 2020 would compare to 2019. And while there was a drop in lead generation in March 2020 that’s to be expected during stay-at-home-orders and the move to more digital retailing, what’s great to see is that more qualified sales leads were generated via chat, form, and phone call over the last year than in 2019.
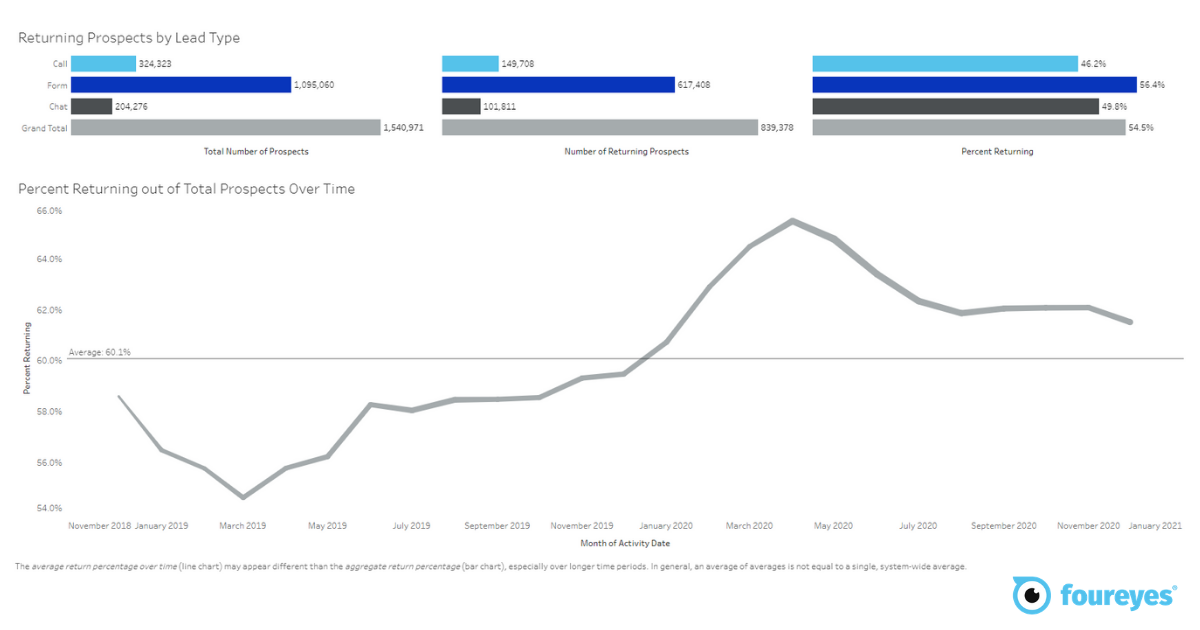
QUALIFIED SALES LEADS ARE RETURNING TO DEALER WEBSITES MORE
We also saw an increase in returning sales leads in 2020. In 2019, about 58% of qualified sales leads returned to shop dealers’ websites, but in 2020 the percentage of returning sales leads increased to above 62%.
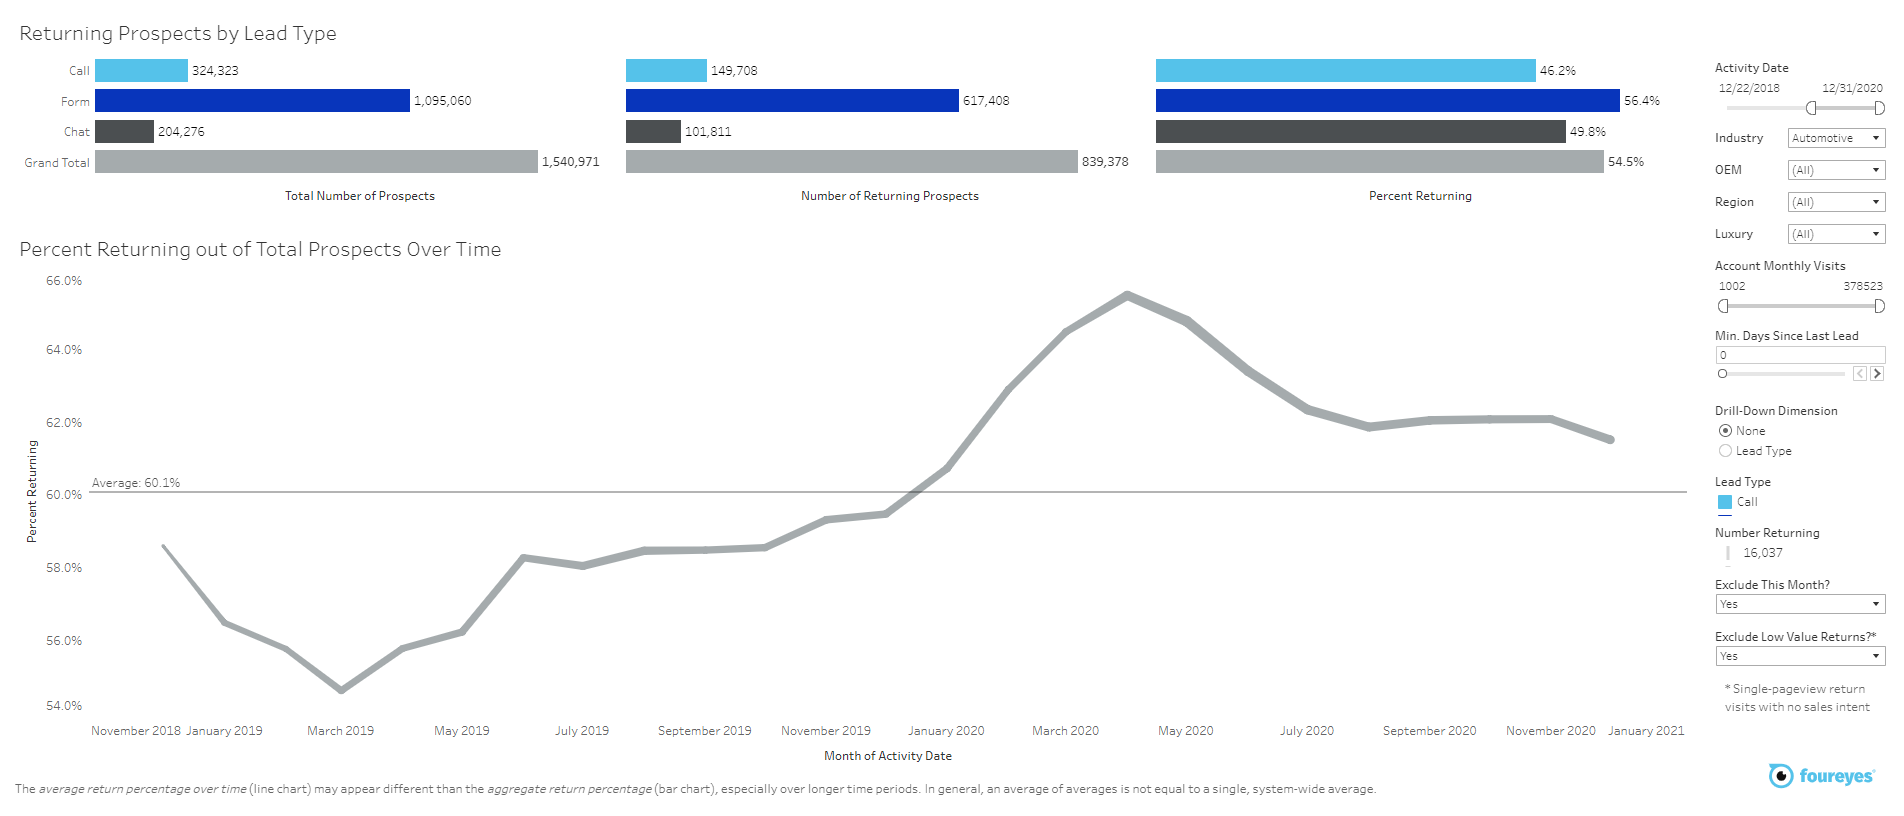
We excluded low-value returns from this dataset—those are when people return to the website but only visit one page without sales intent, for example. So what this tells us is that interested shoppers are spending more time on dealer websites and returning to browse inventory multiple times. This is a positive for the industry as automotive has placed more emphasis on digital retailing and engaging potential customers online.
UNLOGGED LEADS ARE DECREASING
Each year we track the percentage of qualified sales leads that don’t make it into the CRM, and we’re really happy to see this number decrease year-over-year.
Year | % of Sales Qualified Leads That Did Not Make It Into the CRM |
2018 | 14.1% |
2019 | 13.3% |
2020 | 10.6% |
Unlogged leads are unnecessarily lost sales opportunities. This is a problem we built Foureyes Safety Net to solve, so we’re really happy to see this number continue to decrease year-over-year.
MISHANDLED LEADS ARE THE SECRET SALES KILLER
We also track the percentage of qualified sales leads that are mishandled, meaning they’re missed, flagged, or not logged in the CRM. Over the past year, 46.7% of leads were mishandled. Unfortunately, this percentage increased from 2019 to 2020.
At a dealership, there’s understandably some cherry-picking that has to happen when you’re prioritizing and following up with leads. Not every lead works out or is worth pursuing, and that’s understandable. But when dealers are missing out on nearly 50% of opportunities to connect with new or returning car shoppers —it’s a problem.
If we look at what the data tell us, it’s that there are plenty of interested customers out there: they’re shopping online, actively reaching out to dealerships, and open to a shopping experience that’s partially or even completely digital. If dealers are going to compete with the online-only brands that are actively trying to encroach on their business, improving lead handling and decreasing the number of qualified sales leads that are mishandled is a good place to start.
Don’t give up on customers too early and lose out on sales simply because the competition is doing a better job of engaging them. Use these benchmarks and the right technology to improve inventory management, lead handling, and sales processes in 2021. If you’re ready to get started, reach out for a demo or start your free trial of Foureyes Prospect Engagement today.