Editor's Note: This blog was originally published April 10, 2020 and has since been updated with the latest data visualizations and information on auto sales in the U.S. during the coronavirus pandemic.
Foureyes is sharing some of the publicly-available data we use to inform our products to help businesses better understand how U.S. auto sales have been affected by COVID-19. Currently there are three interactive dashboards that enable dealers and OEMs to explore new and used sales data across the country and within their own ZIP code.
Learn how to use each of the following data visualizations below:
- The Effects of COVID-19 On U.S. Auto Sales
- A Closer Look at Auto Sales in Each State
- Shelter-in-Place Effects on Auto Sales
1. The Effects of COVID-19 On U.S. Auto Sales
In this data visualization, Foureyes shows the effects of COVID-19 on U.S. auto sales. The dataset includes inventory details, pricing, and messaging collected from dealership websites. Find more details about this dataset here.
There are three tabs that offer different views of this dataset:
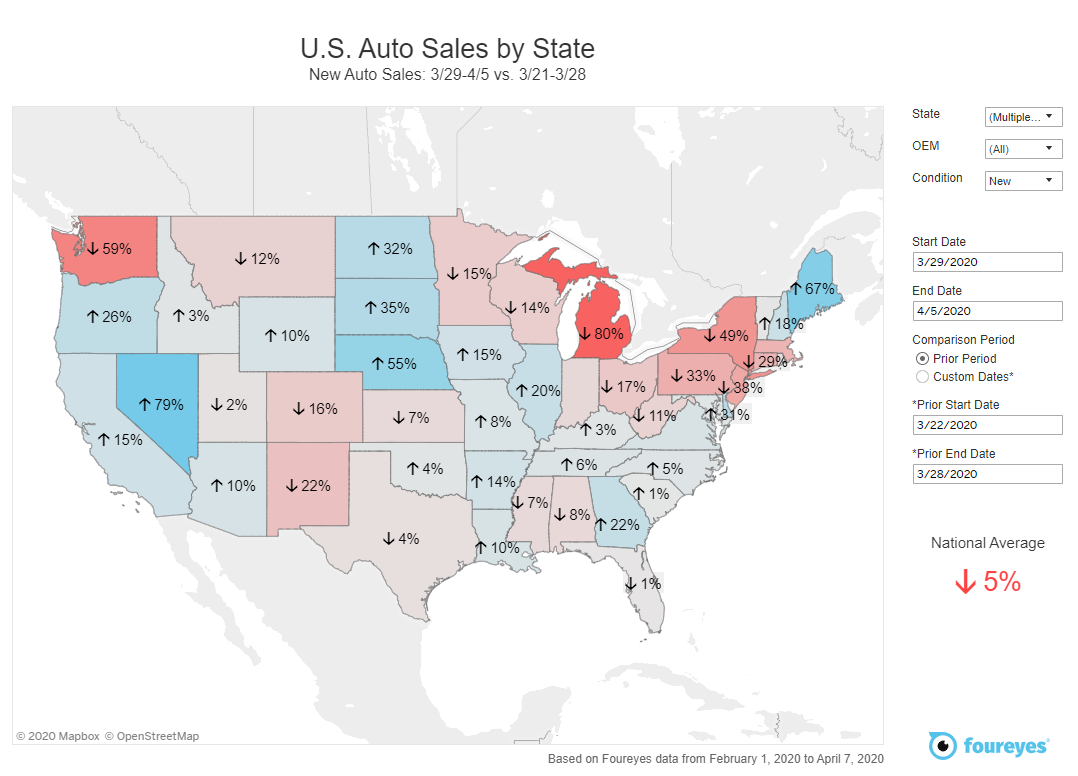
Tab 1: U.S. Auto Sales by State
Explore the effects of COVID-19 on car sales by state across the country.
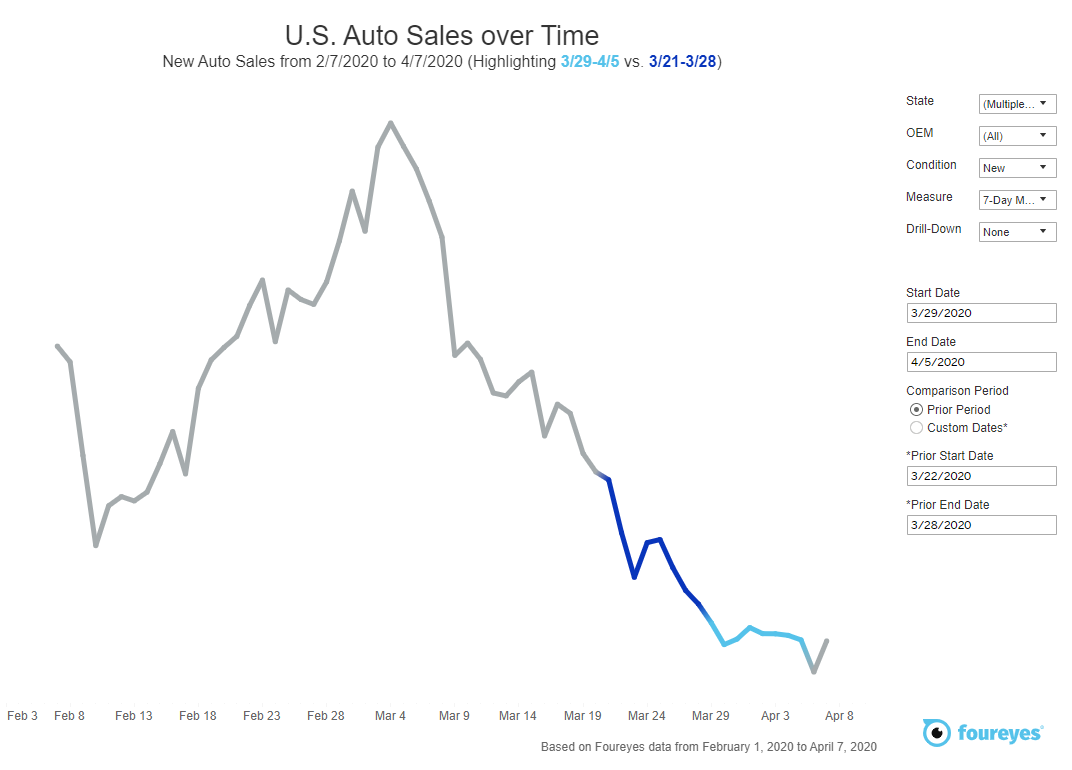
Tab 2: U.S. Auto Sales By Date
Explore the effects of COVID-19 on car sales over time.
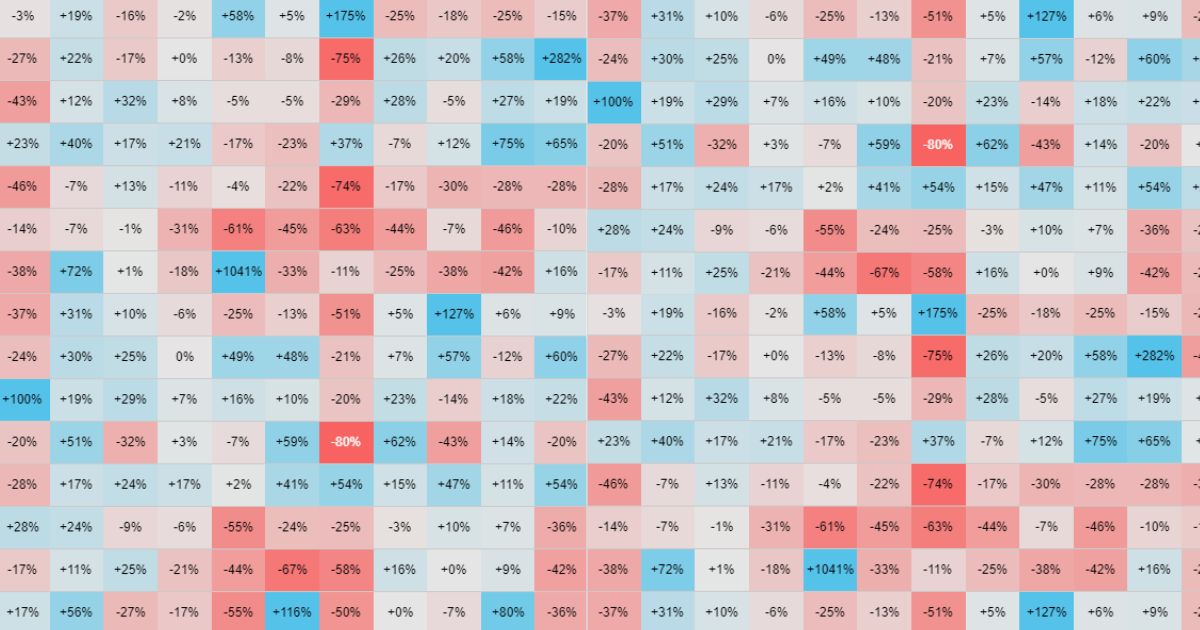
Tab 3: U.S. Auto Sales by OEM
Explore the effects of COVID-19 on car sales by OEM.
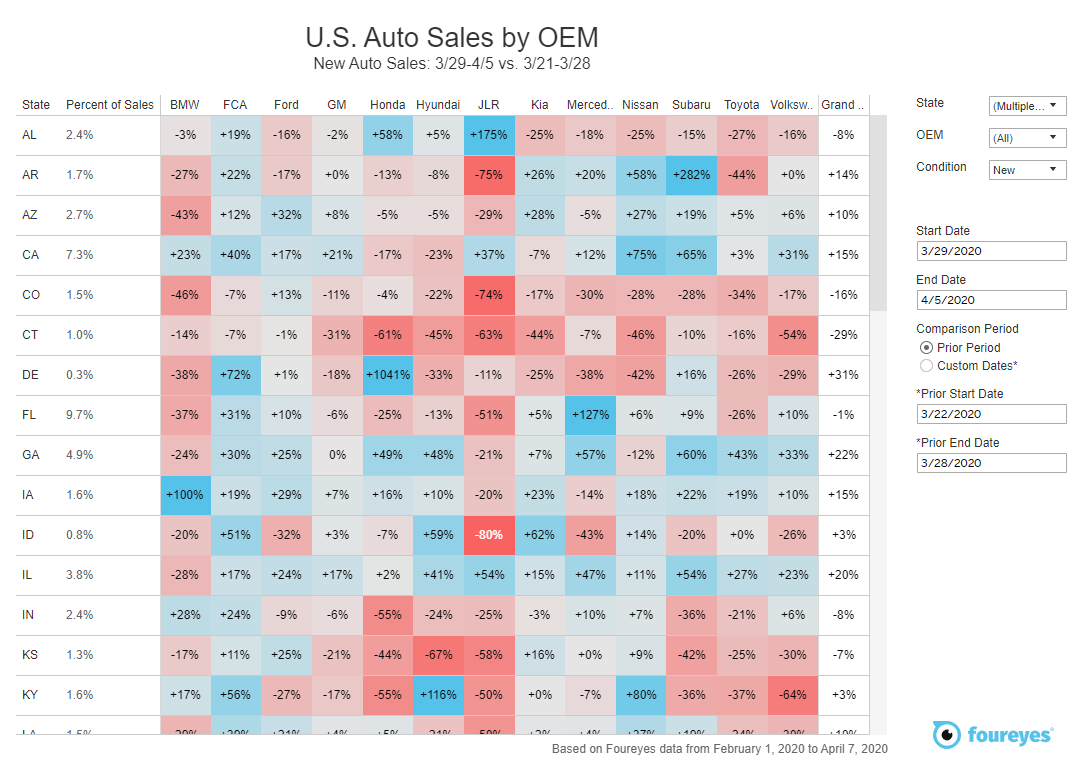
On each tab, choose a time period and then filter by state, OEM, and/or vehicle condition. By hovering over the different views on each tab, you’ll get more detailed information like sales performance broken down by OEM or the exact date.
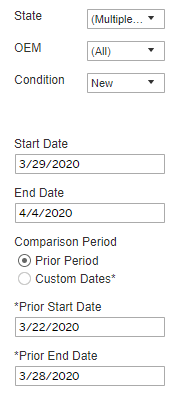
Choose a time period
First, select the time period you want to look at. Note that your date filter will carry over as you explore from tab to tab.
Using the filters, choose a Start Date and End Date. If you have the Comparison Period, Prior Period bubble selected, the map will automatically update to show you data for your selected time period versus the previous time period. If you would like to choose a custom length Comparison Period, select the Custom Dates* bubble and adjust the *Prior State and *End Dates.
- Tip: For month-over-month comparisons, make sure to go by the OEM reported months versus the standard end of month if you want to see it from an OEM lens (for example, set the end of February to March 2 or 3).
Zoom in on state, OEM, or vehicle condition
If you’re interested in looking at a single or select group of OEMs, use the OEM filter and check or uncheck from the OEMs list. Then click, Apply.
- Tip: View the complete list of OEMs and brands included in this data here.
If you’re interested in a particular state’s sales performance, use the State filter and check or uncheck from the complete list of contiguous states. Then click, Apply.
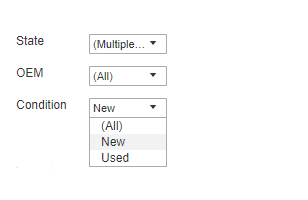
You can also filter by vehicle condition, new or used. Just select the vehicle condition from the Condition filter dropdown list.
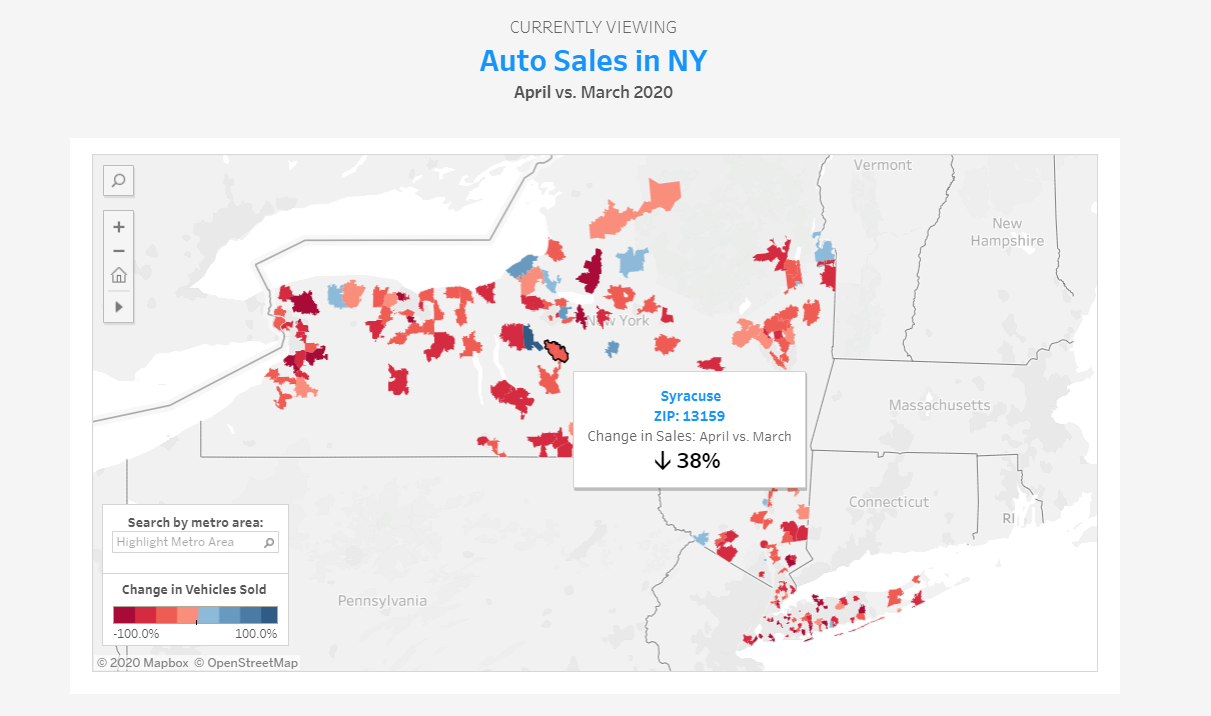
2. A Closer Look at Auto Sales in Each State
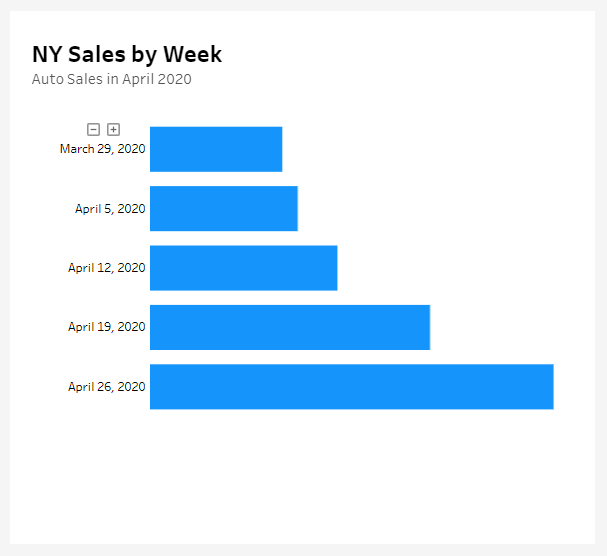
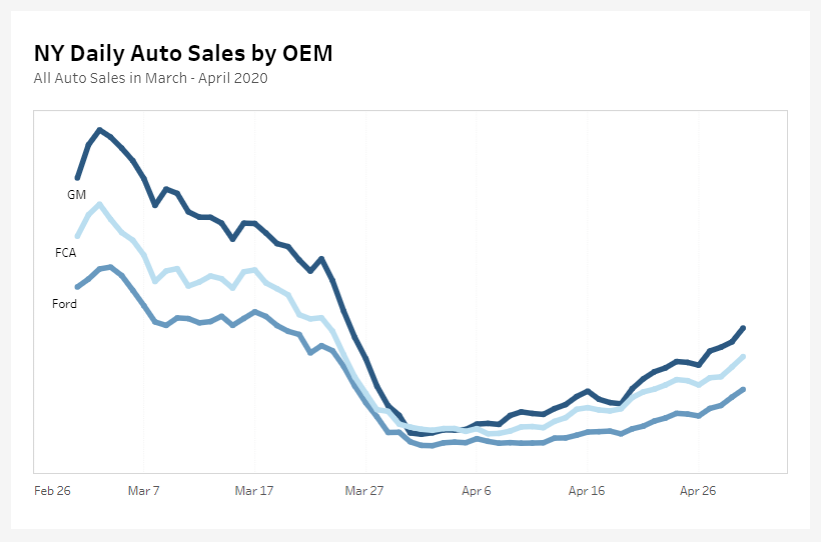
In this data visualization, Foureyes shows a closer look at auto sales in each state. The dataset includes month-over-month sales performance by metro area, daily sales by OEM, and state-wide sales by week. Find more details about this dataset here.
Explore the data by selecting a state from the dropdown and hovering over the map. Double-click or zoom to see sales performance by zip code.
Auto Sales by State
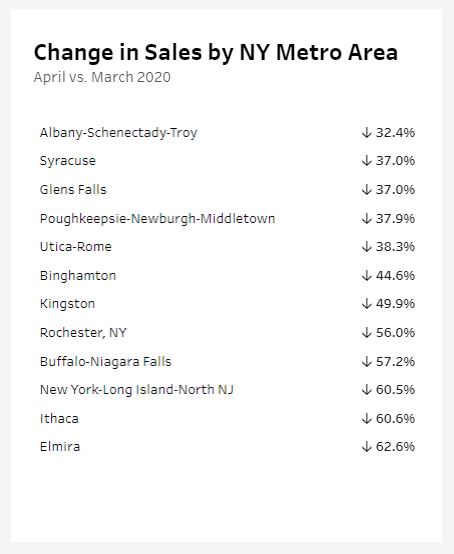
Change in Car Sales by Metro Area
State Sales by Week
Daily Sales by OEM
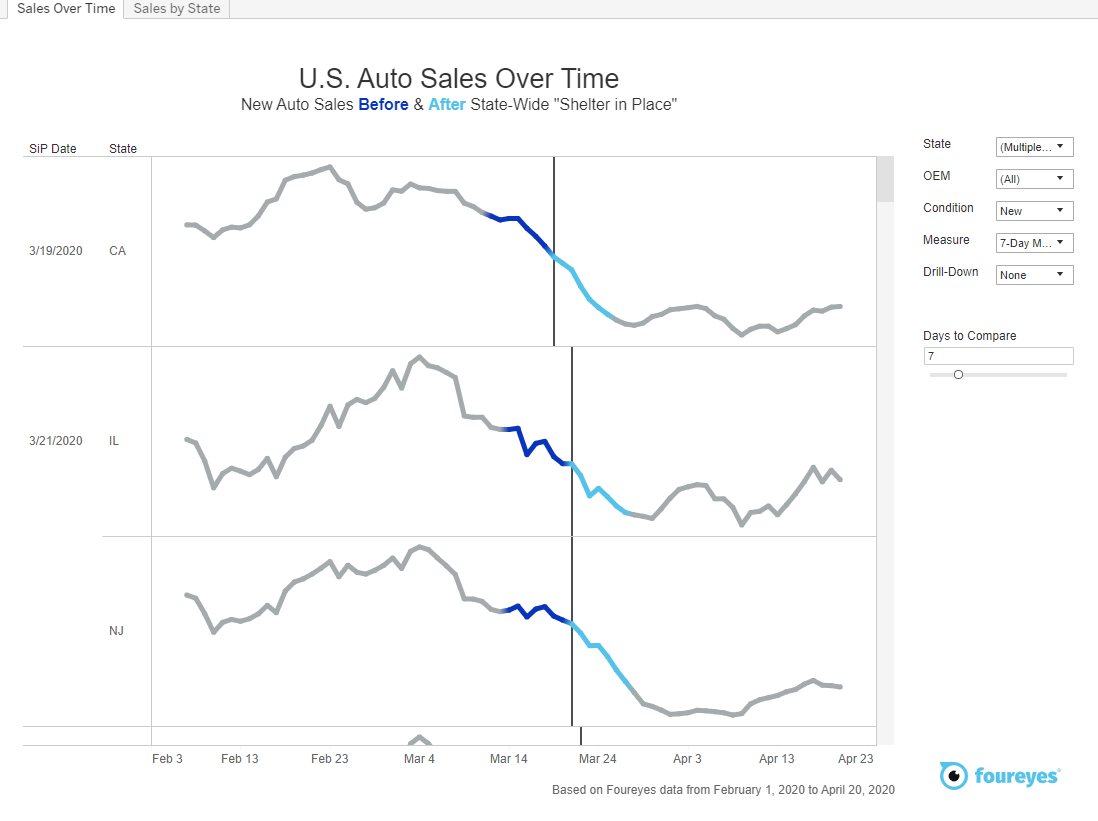
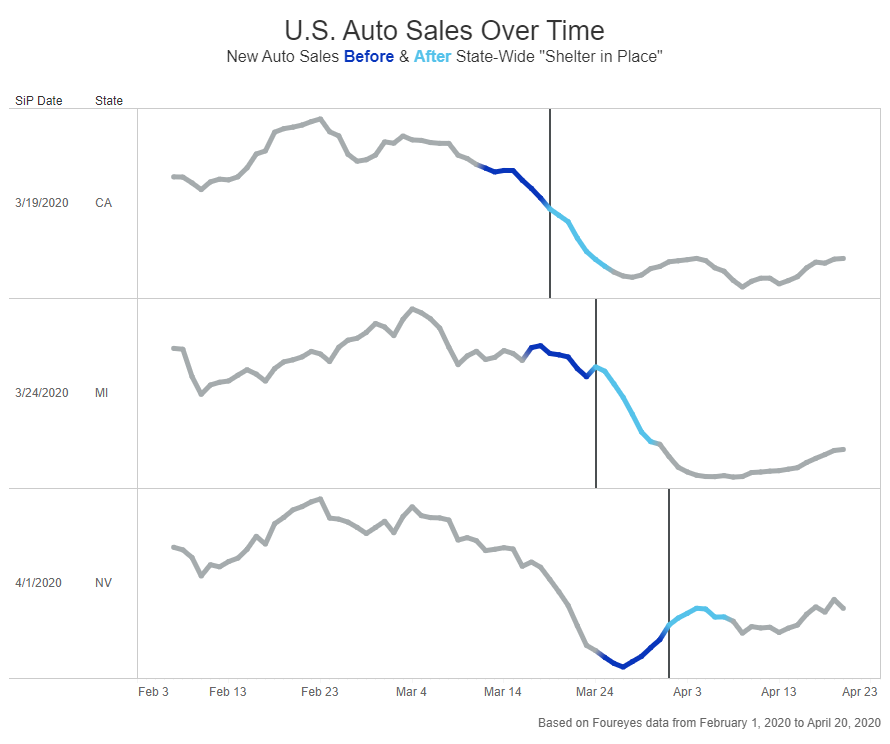
3. Shelter-in-Place Effects on Auto Sales
In this data visualization, Foureyes shows auto sales before and after state-wide shelter-in-place orders. The dataset includes new and used inventory details collected from dealership websites. Find more details about this dataset here.
There are two tabs that offer different views of this dataset.
Tab 1: Auto Sales Before and After Shelter-In-Place Orders
Explore the effects of social distancing and stay-at-home orders on car sales over time.
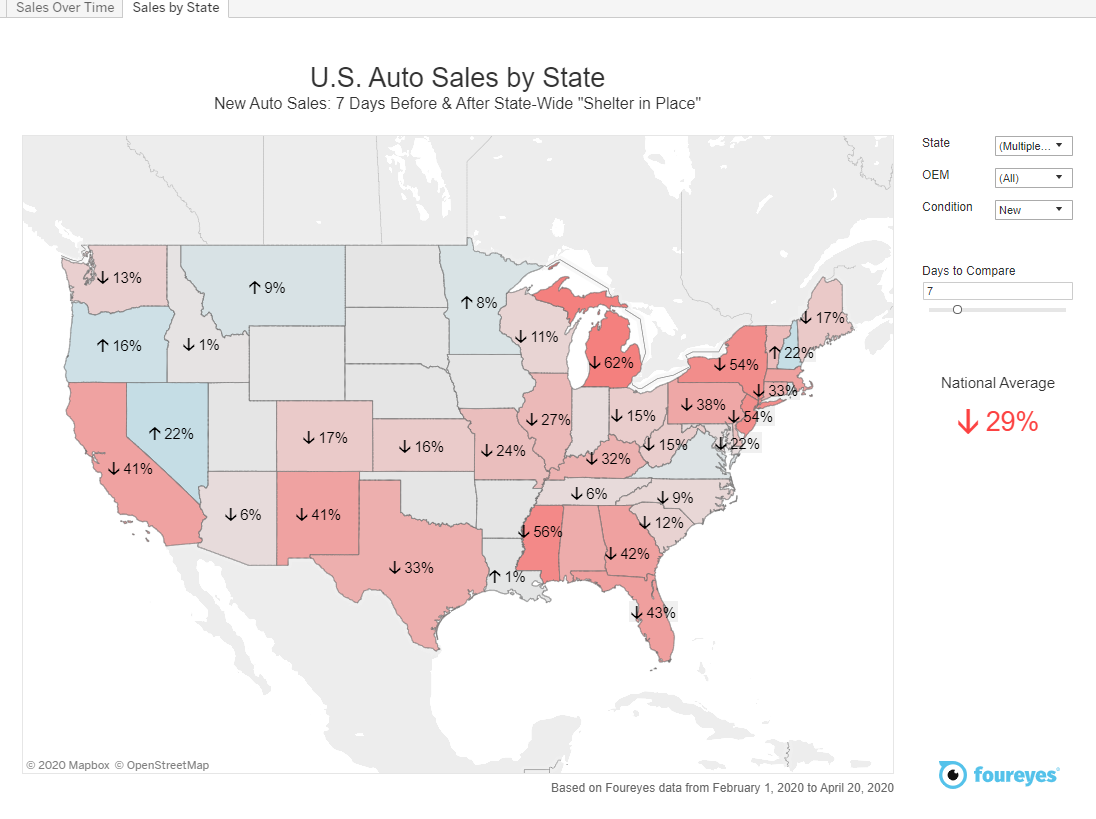
Tab 2: Auto Sales by State
Explore the effects of COVID-19 shelter-in-place orders on car sales by state.
On each tab, choose the number of days to compare and then filter by state, OEM, and/or vehicle condition. By hovering over the different views on each tab, you’ll get more detailed information like sales performance broken down by OEM or the exact date. Learn more about exploring the data here.
Zoom in on state, OEM, or vehicle condition
First, select the timeframe you want to look at. Note that the number of days you choose to compare will carry over as you explore from tab to tab.
If you would like to zero in on your state, select and unselect All before choosing your state from the dropdown list. If you would like to compare neighboring states, select multiple states from the list.
If you’re interested in looking at a single or select group of OEMs, use the OEM filter and check or uncheck from the OEMs list. Then click, Apply.
- Tip: View the complete list of OEMs and brands included in this data here.
If you want to filter by vehicle condition, select New, Used, or All from the Condition filter dropdown list.
Learn More
If you’re interested in additional data and resources, visit our data hub or reach out directly and a member of our team will be in touch.