
For the fifth consecutive year, Foureyes released its new automotive industry benchmarks. This data is intended to help dealers and dealer groups compare their performance against the industry and track trends in how leads behave – all in an effort to help you know what it takes to beat the competition and exceed your sales and marketing goals in 2023.
This year, Foureyes tracked, analyzed, and aggregated data from December 2021 - November 2022, which included more than:
- 700 million dealer website visits
- 11 million unique pieces of inventory
- 21,500 automotive dealership websites (including group sites)
To provide clear benchmarks, this report filters out website activity from bots, solicitors, job seekers, service customers, and other non-sales leads that dealers nationwide received.
Mishandled Leads
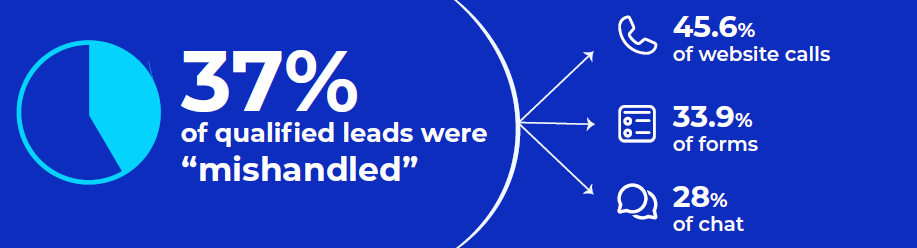
Dealers don’t want to leave prospects hanging out to dry, but it still happens. Overall, 37% of qualified leads were mishandled – that means leads with true buying intent weren’t logged to CRMs, had their calls missed, or experienced delayed follow-up. This metric has now improved year-over-year from each of the past two reports (41.6% in 2022, and 46.7% in 2021).
Hello??
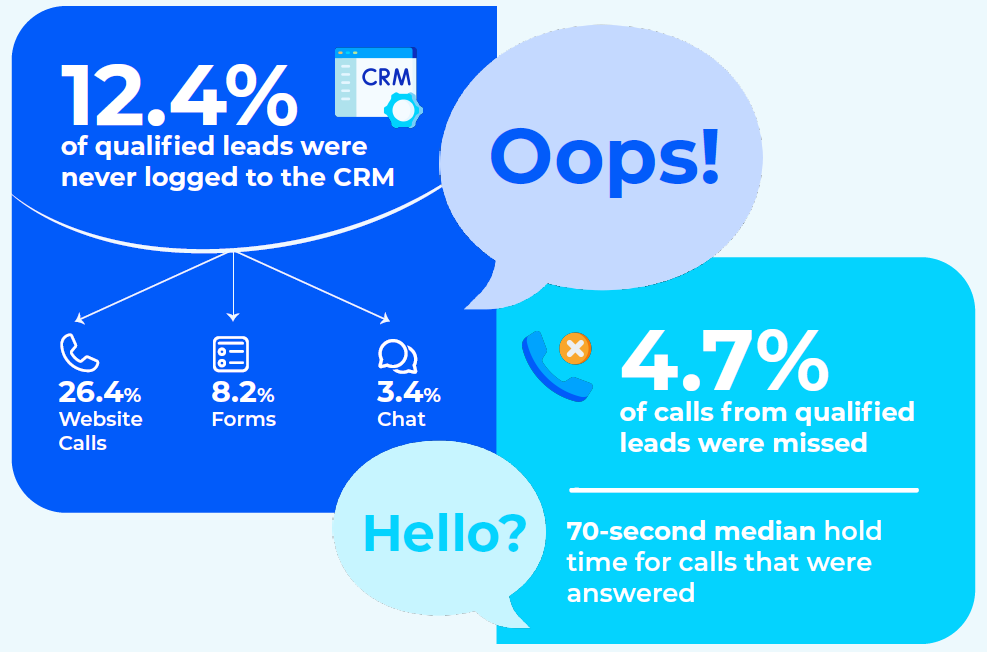
Continuing to explore the types of “mishandled” leads, we found that 12.4% of qualified leads (i.e. again, have sales intent vs service calls or solicitors) were never logged to the dealer’s CRM – most of those (26.4%) stemming from website calls. This number is actually on the rise – in 2021, we saw 10.6% of leads going unlogged, and 11.7% in 2022. Low inventory is frequently the supposed answer for why this continues to increase – i.e. dealers knew they couldn’t help customers get what they wanted, and potentially were less incentivized to return phone calls or enter leads into their CRMs. While dealers may see a short term rise in their close rates (less leads in the overall bucket), they’re ultimately losing out on future deals when inventory inevitably returns.
Don’t you forget about me :(
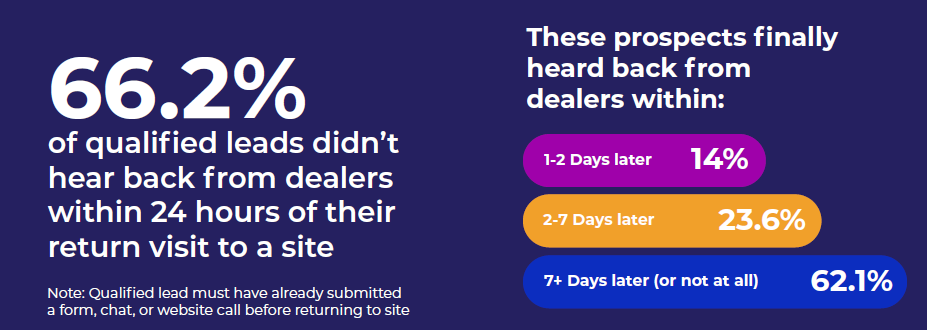
This 66.2% statistic has held fairly constant over the last several years, according to Foureyes data. Dealers have dedicated resources into improving the sales process and customer experience, but aren’t necessarily seeing the fruits of their labor.
Lead Attribution
Here’s a funnel breakdown of more than 63 million dealership website visitors across the United States.
Calls via dealer websites generated the most “Leads,” however Forms accounted for the most “Qualified Leads” (i.e. those actually in the market to buy) and “Sold Leads."
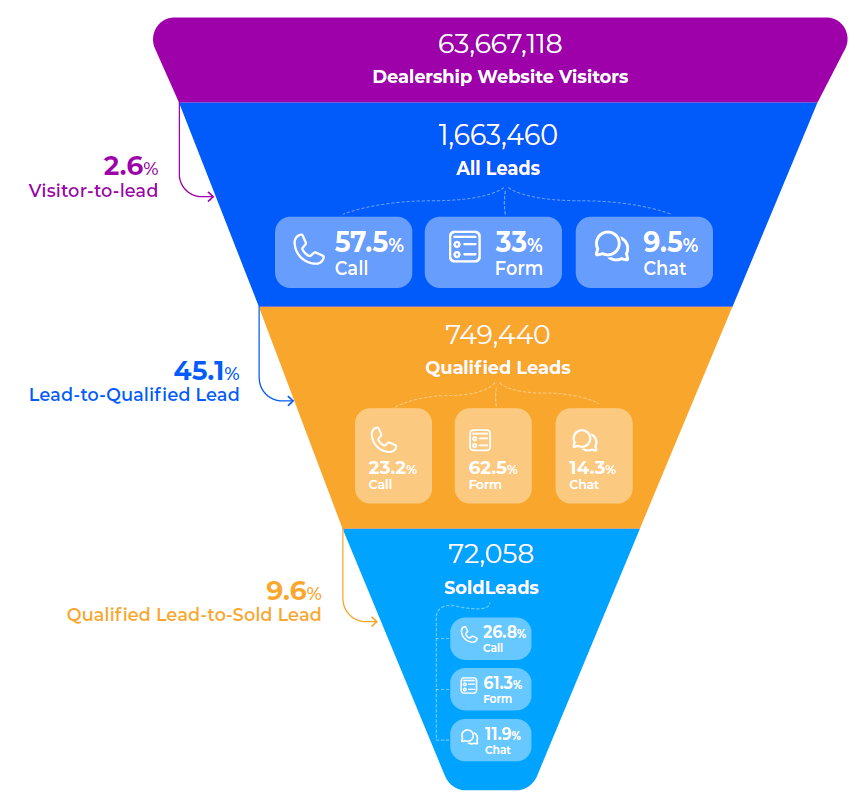
A lot of dealers focus on conversion rates from visitor-to-lead. But we’re not seeing that number improve over time – it actually decreased from last year’s report (which analyzed much of 2021), where we saw a 2.8% conversion rate.
The number that probably matters to more dealers is “Lead-to-Qualified Lead.” Qualified leads are defined to filter out spam, bots, friends and family just calling to chat with staff, service leads, etc. How are your vendors filtering out those junk leads to really help your team get to the bottom of where your leads are coming from?
Days to Close
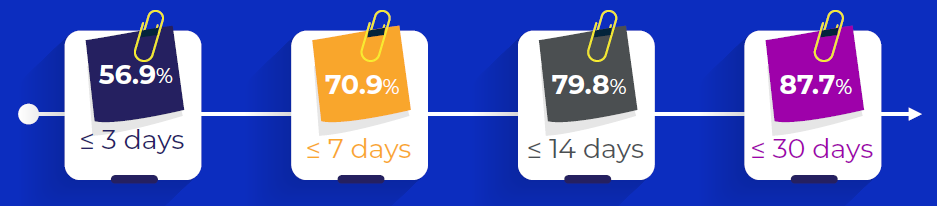
Among qualified leads that buy, 56.9%+ do so within three days of filling out a form, chat, or website call.
This is trending upwards in comparison to previous years, which is unsurprising when factoring in low inventory. People inquire about a specific vehicle, but ultimately find it unavailable and continue on their search.
Leads by Channel
Which channels are dealers using to not just generate leads, but generate the right leads that will actually buy? (i.e. “Qualified” and “Sold” leads)
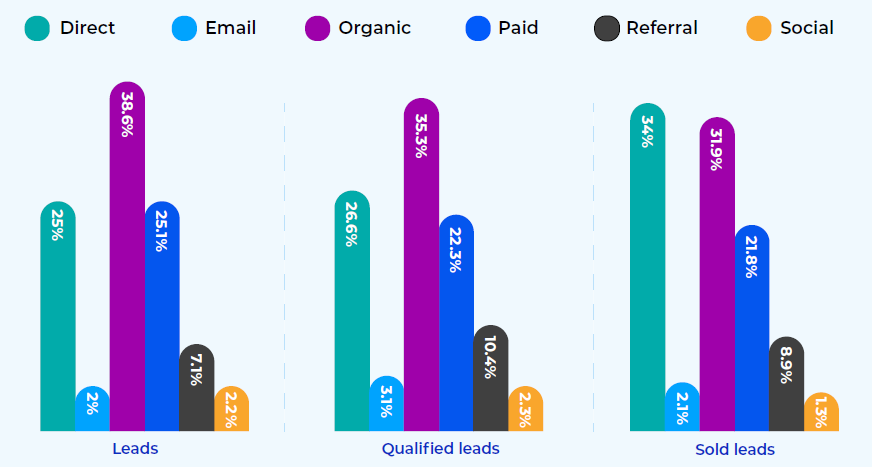
A higher percentage of Sold Leads (far right graph) came in with a “Direct” attribution, making it easy to see the value of personalized sales. Paid ads held steady across the three groups, indicating that customers are receptive to multiple touch points.
Inventory Volume Change
Notable last year, new inventory re-surpassed used inventory in November 2022 for the first time since April 2021.
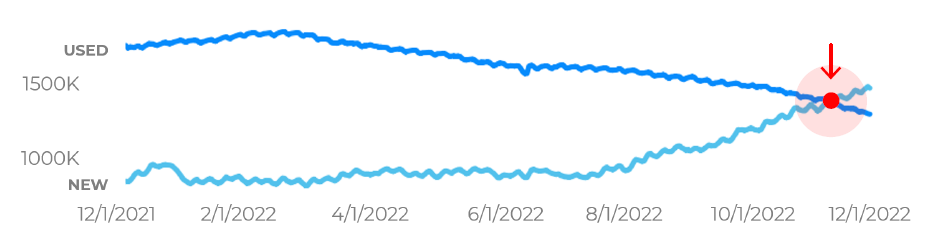
While we are seeing inventory as a whole begin to rebound, that isn’t consistent for all dealers. Inventory continues to fluctuate depending on region, OEM, and even model.
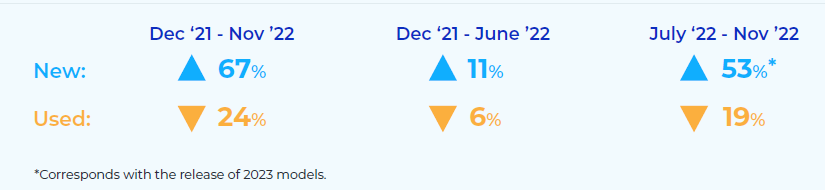
The below table shows inventory percent change for the full 12 months, as well as the first and second halves of this reporting period. Notable in the second half of the year (July 2022 - November 2022) is the release of new 2023 model year inventory.
Price Listings
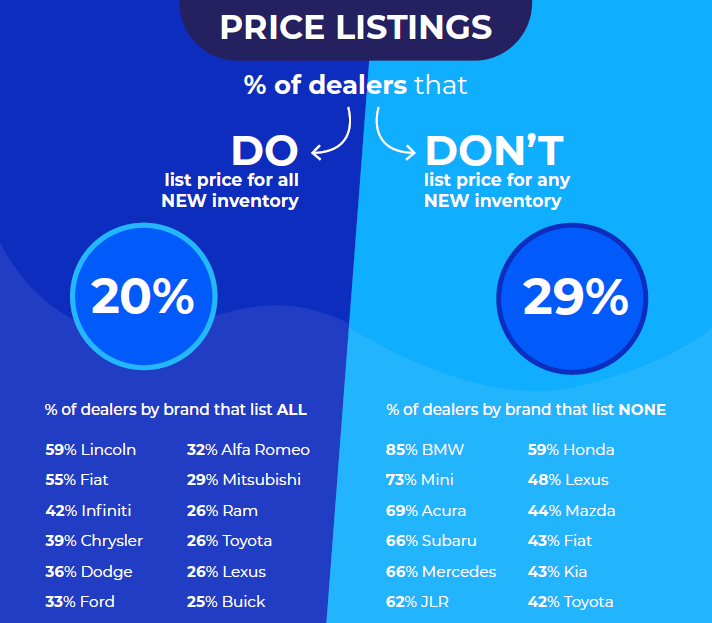
We often see domestic brands listing price more frequently than international or luxury brands. It’s helpful to note that those who don’t list price for any new inventory may also include sites requiring customers to submit more information to gain access to pricing information.
Inventory and Price Adjustments
This section is a snapshot of dealer activity in November 2022 – i.e. the most recent month of this report’s timeframe.
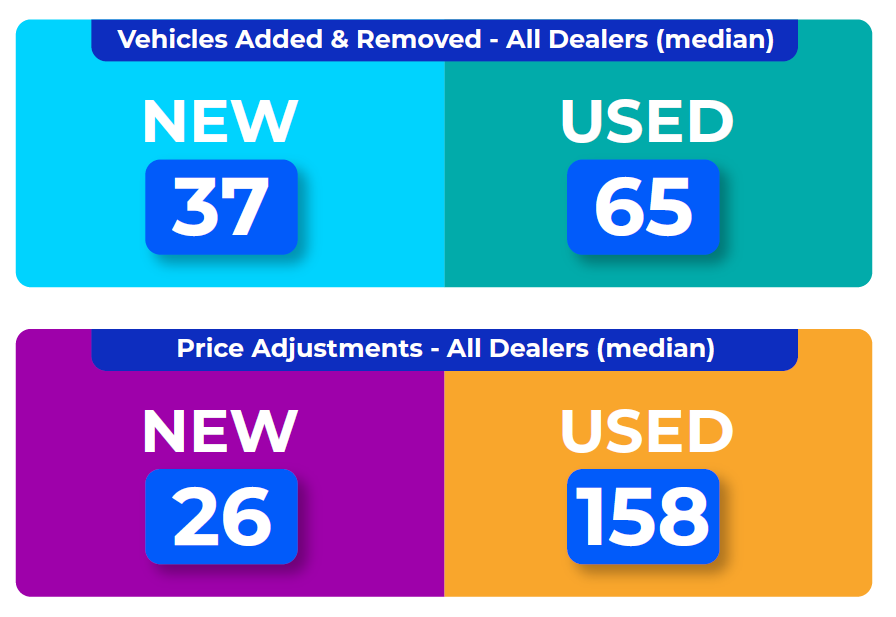
While this is just a snapshot of November 2022 data to demonstrate the most recent data from this reporting period, as a whole, we’re seeing a lot more price adjustments on used vehicles than new.
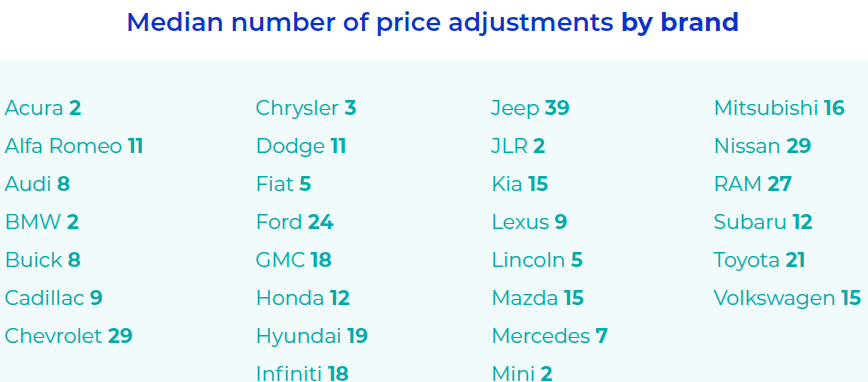
If we break it down further and look by OEM, we again see that domestic brands run a lot more incentives and price adjustments.
Beat These Benchmarks
Take advantage of these industry insights to keep a pulse on what’s happening in the market.
But you don’t have to do it alone. Foureyes quickly helps dealers and their groups close more of the leads they already have (in their CRMs, and from their website activity and inventory).
Connect with us here– or watch below – to learn how!